
Figures & data
Table 1 “Textword” searches
Table 2 Subgroups of effect modifiers employed in the meta-analysis and meta-regression
Figure 1 PRISMA diagram of searching and screening process.
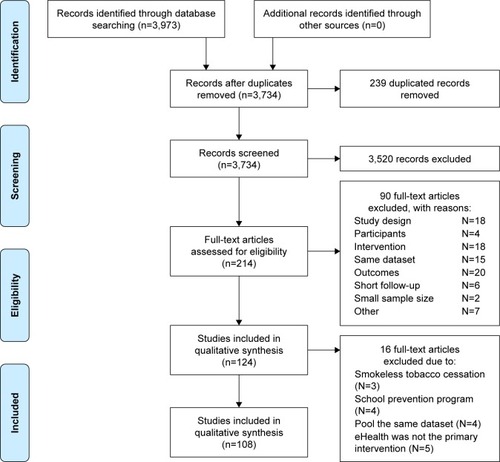
Table 3 General characteristics of included studies (n=91)
Figure 2 Risk of bias graph based on review authors’ judgments across all included studies.
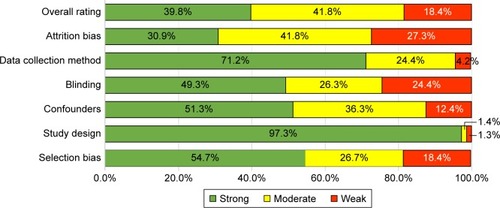
Figure 3 Forest plot of web based intervention effects by characteristics of control group.
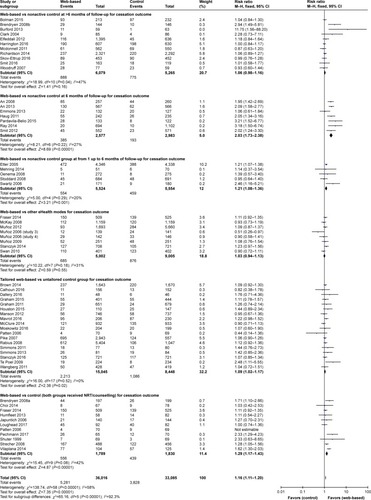
Figure 4 Forest plot of mHealth intervention effects by characteristics of control group.
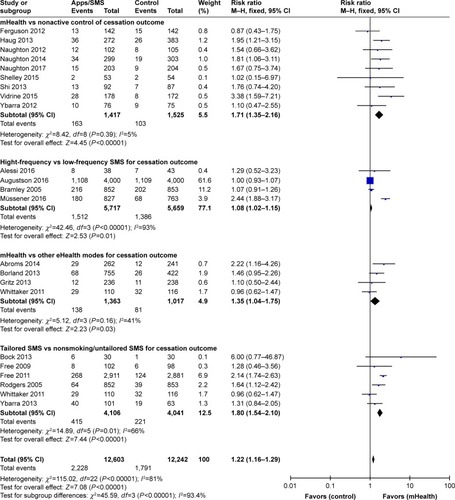
Figure 5 Forest plot of computer-assisted intervention effects by characteristics of control group.
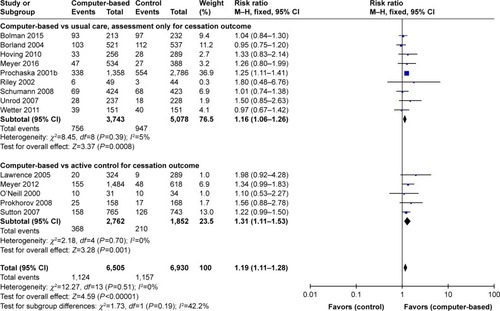
Table 4 Summary of findings on effects of eHealth smoking cessation interventions, based on GRADE guidelines
Table 5 Core effect modifier using meta-regression, stratified by eHealth platforms