Figures & data
Figure 1 Process flow chart.
Note: Calculations for the analysis were performed using Microsoft Office 2007 software package (Microsoft Corporation, Redmond, WA, USA).
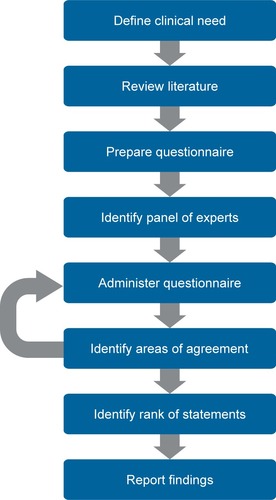
Figure 2 Distribution of HCP categories among responders to the first round of the Delphi analysis (total number of responders =85).
Abbreviation: HCP, health care provider.
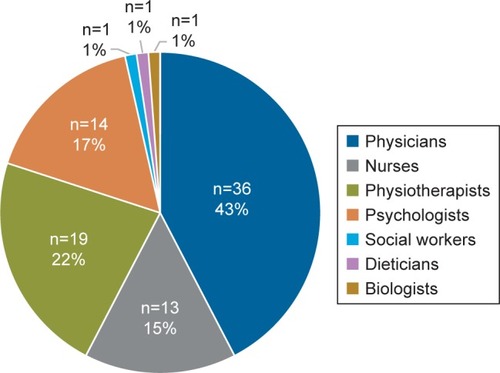
Figure 3 Ranking of statements with a high level of agreement in the “General Aspects” area.
Note: Results from all 38 statements are provided in Table S1.
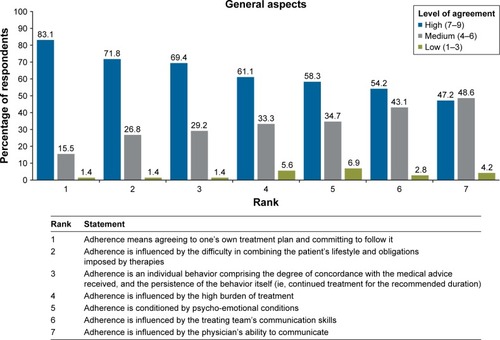
Figure 4 Ranking of statements with a high level of agreement in the “Roles and Relational Aspects” area.
Note: Results from all 27 statements are provided in Table S2.
Abbreviation: HCP, health care provider.
Abbreviation: HCP, health care provider.
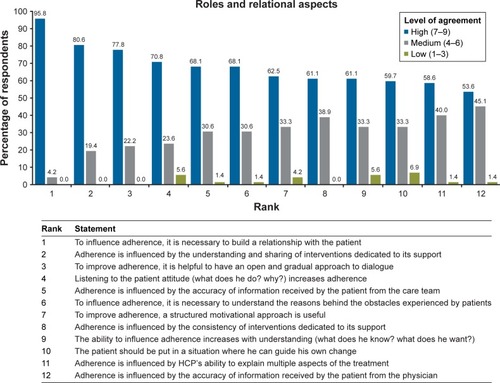
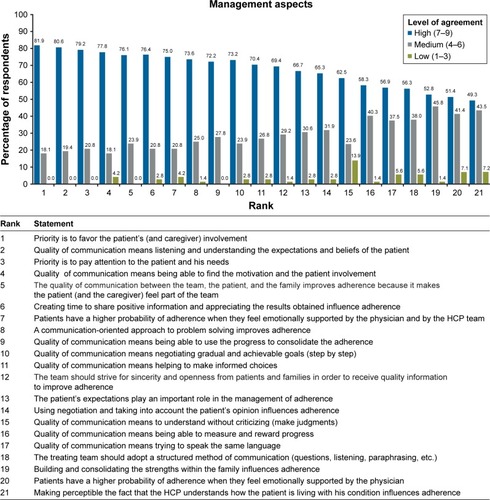
Figure 5 Ranking of statements with a high level of agreement in the “Management Aspects” area.
Note: Results from all 29 statements are provided in Table S3.
Abbreviation: HCP, health care provider.
Abbreviation: HCP, health care provider.