
Figures & data
Table 1 Participants’ descriptive characteristics (N=504)
Table 2 Participants’ ranking of the elements of dental professionalism (N=504)
Figure 1 Domains and subdomains of professionalism model and influencing factors.
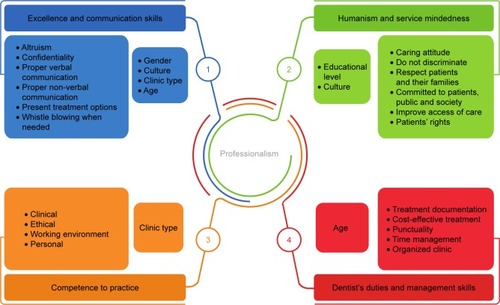
Table 3 Independent t-tests showing mean differences between gender, nationality, and type of clinics/hospitals where the participants were treated
Table 4 ANOVA showing mean differences between age and education level groups
Table 5 Independent t-tests showing mean differences between perceptions of patients and dentists