
Figures & data
Table 1 Association between patients’ sociodemographic characteristics and adherence level to DM medication
Table 2 Association between clinical variables and medication adherence
Table 3 Patients’ self-reported adherence to diabetic medications according to the MGLS
Figure 1 The frequency and percentages of respondents according to MGLS score.
Abbreviation: MGLS, Morisky Green Levine Medication Adherence Scale.
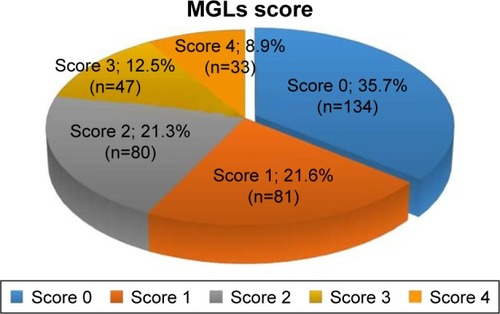
Figure 2 The frequency and percentage of patients in each MGLS category.
Abbreviation: MGLS, Morisky Green Levine Medication Adherence Scale.
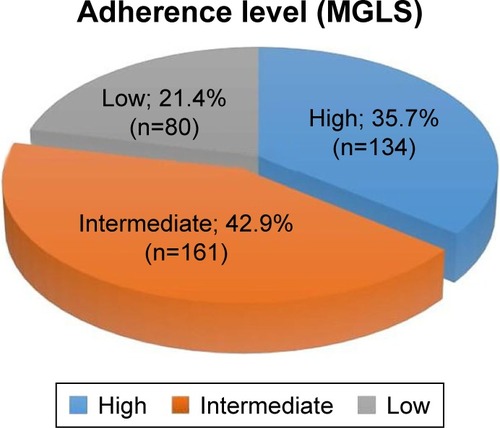
Table 4 Multivariable analysis of the association between adherence level and sociodemographic and clinical factors among patients with diabetes