Figures & data
Table 1 Distribution of clinical departments and proportion of samples
Table 2 Demographic characteristics (N=872)
Table 3 Twenty items used to calculate the mean patient satisfaction score (SD) and standardized coefficients (beta)
Table 4 Overall satisfaction of patients with different sociodemographic characteristics
Table 5 Multiple stepwise regression analysis of the risk factors affecting overall satisfaction score (N=872)
Figure 1 The importance matrix analysis modeling method.
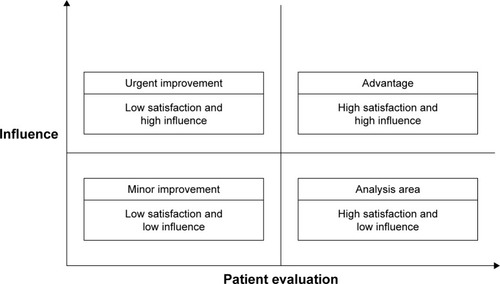
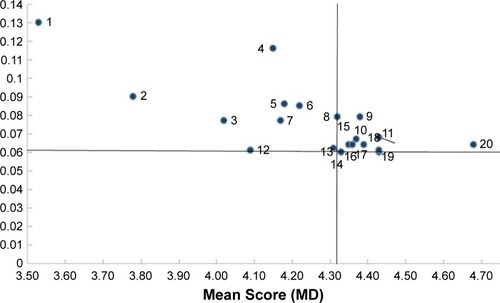
Figure 2 The importance matrix analysis of inpatient satisfaction.
Notes: (1) Diet management; (2) Medical expenses; (3) Complaint management; (4) Frequency of nurses’ ward rounds; (5) Frequency of doctors’ ward rounds; (6) Informed consent; (7) Hospital environment; (8) Doctors’ service attitude; (9) Health education; (10) Admission process; (11) Nurses’ technical skill; (12) Auxiliary examination; (13) Patient identification; (14) Medical ethics; (15) Patients’ privacy protection; (16) Overall service process; (17) Transparency; (18) Nurses’ service attitude; (19) Doctors’ technical skill; (20) Emergency response.