
Figures & data
Table 1 The characteristics of the subjects
Figure 1 The percentage of participants who answered “yes” to the following questions: (A) Do you think a patient should be informed about cancer diagnosis? (B) Do you think a patient should be given all the details of his cancer status? (C) When do you think a patient should be informed about cancer? *P<0.05; **P<0.001.
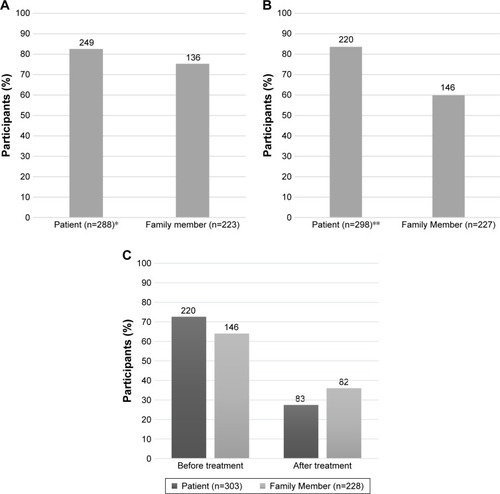
Table 2 Differences in attitudes toward disclosure of cancer diagnosis
Table 3 Binary logistic regression analysis predicting disclosure of cancer