Figures & data
Figure 1 Flowchart of the study design and procedures.
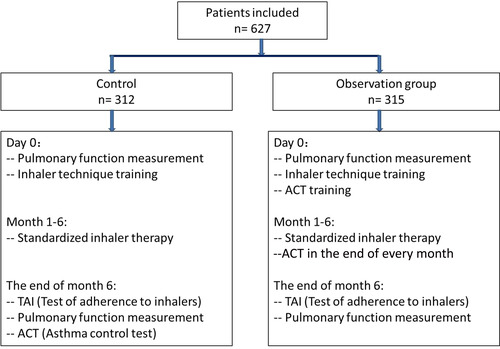
Table 1 Comparison of Patients’ Adherence to Inhalers Between the Two Groups
Figure 2 TAI results of patients: (A) average scores of items 1–10; (B) patients’ choice on items 11 and 12. *Compared with control, P < 0.05; **compared with control, P < 0.01.
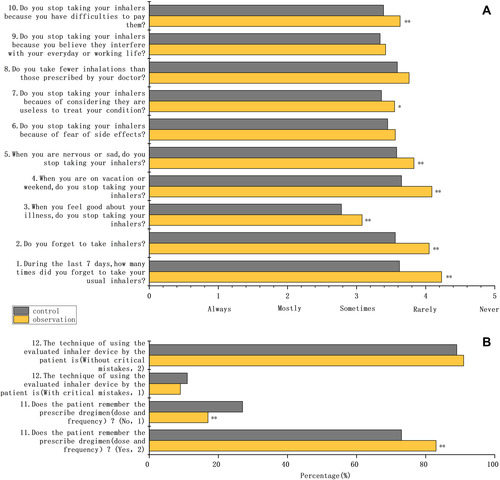
Table 2 Comparison of Lung Function of Patients Between Two Groups (Mean ± SD)
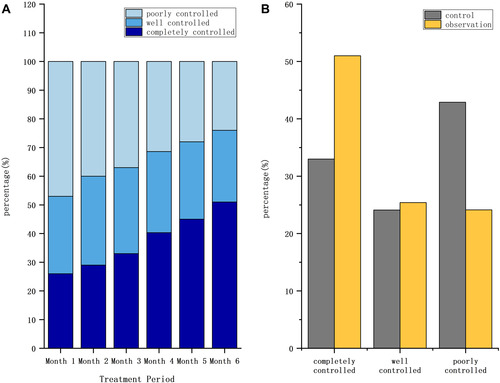
Figure 3 Asthma control evaluated by ACT scores: (A) in the observation group; (B) comparison between control and the observation group after treatment.