Figures & data
Table 1 Patient characteristics and prescribed medication on the first and second visits (mean ± SD); n=24
Table 2 Screened drugs, prescription frequencies, and corresponding plasma drug results (n=24)
Table 3 Nonadherence and unreported drug use among study participants according to plasma drug screening
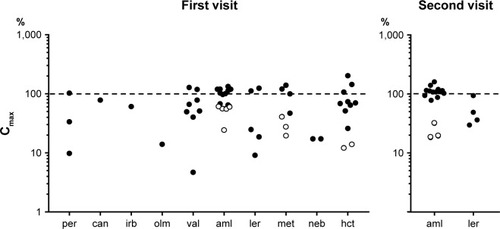
Figure 1 Plasma concentrations of antihypertensive drugs on the first and second visits expressed as ratios with expected peak concentrations (Cmax, 100%); logarithmic representation.
Notes: Only prescriptions confirmed in plasma are shown. Solid circles indicate results ≥expected Cmin and empty circles indicate results <expected Cmin. Expected mean Cmax (highest/lowest daily dose) and Cmin values (% Cmax) were as follows: per 36.4/15.1 ng/mL (7%/5%); can 234 ng/mL (28%); irb 2,040 ng/mL (5%); olm 507 ng/mL (4%); val 5,550/3,940 ng/mL (18%/3%); aml 17.5/10.5 ng/mL (79%/57%); ler 7.7/3.3 ng/mL (5%/1%); met 53.5/11.2 ng/mL (70%/24%); neb 1.5 ng/mL (7%); hct 260/70 ng/mL (14%/9%).
Abbreviations: aml, amlodipine; can, candesartan; hct, hydrochlorothiazide; irb, irbesartan; olm, olmesartan; per, perindopril; val, valsartan; ler, lercanidipine; met, metoprolol; neb, nebivolol.
Abbreviations: aml, amlodipine; can, candesartan; hct, hydrochlorothiazide; irb, irbesartan; olm, olmesartan; per, perindopril; val, valsartan; ler, lercanidipine; met, metoprolol; neb, nebivolol.