
Figures & data
Figure 1 Formula for frequency of indicator (∑I = sum scores of items per indicator, Nk = number of items per indicator, and Nj = number of respondents per year).
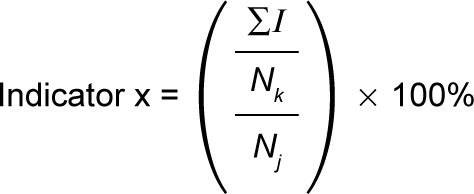
Figure 2 Number of referrals per year 1996–2011 (N = 810).
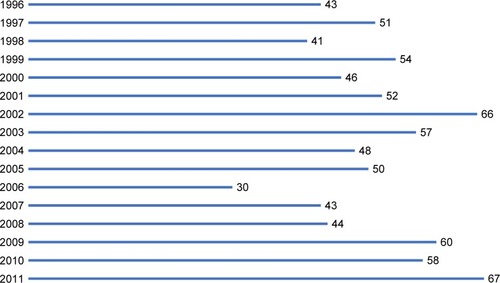
Table 1 Diagnostic process: differences between Group A 1996–2002 (n = 353) and Group B 2003–2011 (n = 457) regarding the clinical reasoning process in patients with Whiplash-associated disorders (WAD)
Table 2 Therapeutic and evaluative process: differences between Group A 1996–2002 (n = 353) and Group B 2003–2011 (n = 457) regarding the clinical reasoning process in patients with Whiplash-associated disorders (WAD) N = 810; n (%) unless otherwise stated
Table 3 Differences between Group A 1996–2002 (n = 353) and Group B 2003–2011 (n = 457) expressed as percentages of QIs of the clinical reasoning process and performance target for physiotherapy in patients with Whiplash-associated disorders (WAD)