
Figures & data
Figure 1 An example to illustrate the calculation of SD as a measure of variability for the time of nebulizer use.
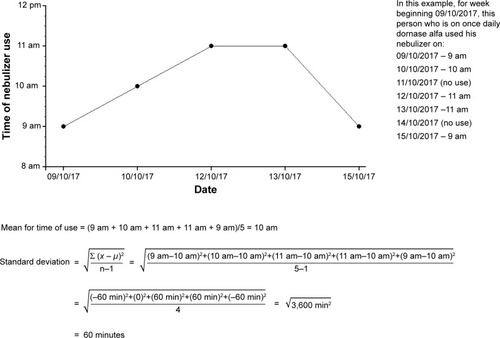
Figure 2 An example to illustrate the calculation of SD for time of use in someone using nebulizer over two sessions.
Notes:
aEvening times were transformed into morning times for accuracy of calculation, otherwise nebulizer taken after midnight may cause spuriously large SD depending on the software used. For example, in someone who uses nebuliser at 23:45, 23:55, 00:15 and 23:52, the difference between 00:15 and 23:55 could be miscalculated as 23 hours and 40 minutes (instead of 20 minutes) if the date was not taken into account. bAlthough this treatment was taken after midnight, it is still part of the evening session treatment for 11/01/2013.
Abbreviation: NA, not available.
Abbreviation: NA, not available.
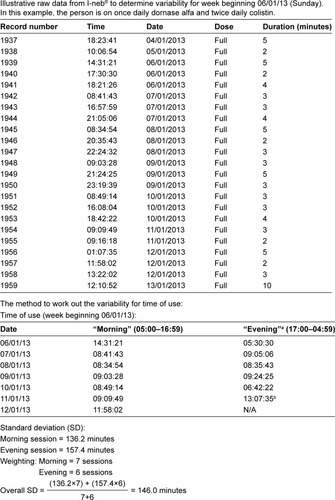
Figure 3 Illustrative habit index (generated from time of nebulizer use) and adherence time series graphs.
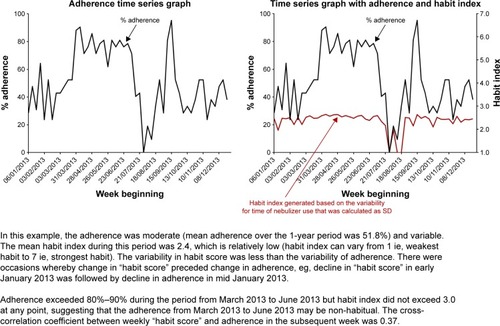
Table 1 The cross-correlation coefficients (R) for the habit index and subsequent adherence
Table 2 The unstandardized regression coefficients (B)Table Footnotea for the habit index, using time-ordered habit index and current adherence as the covariates with subsequent adherence as the dependent variable in a multiple regression