
Figures & data
Table 1 Participant self-reported demographics and characteristics
Table 2 Participant-reported diabetes tests, A1C test results, and A1C targets
Figure 1 Participant perceptions of diabetes control and complications (part 1).
Notes: Responses to survey questions. (A) To what extent do you believe your diabetes is under control? (B) If you were to stay at your current level of diabetes control, for how long do you think you could avoid any serious complications due to your diabetes?
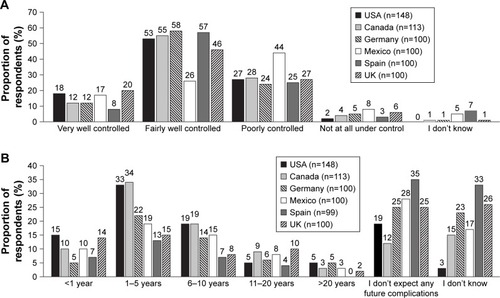
Figure 2 Participant perceptions of diabetes control and complications (part 2).
Notes: Responses to survey questions. (A) What do you think is likely to happen to you in the short term (within 1 year) if your diabetes stays at the same level of control? (B) What do you think is likely to happen to you in the long term (after 5 years) if your diabetes stays at the same level of control?
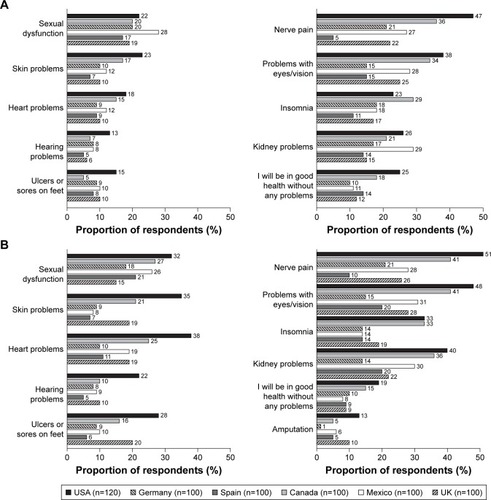
Figure 3 Participant behaviors relating to diabetes management.
Notes: Responses to survey questions. (A) How often do you miss or skip appointments, for any reason, with a healthcare provider to discuss or review your diabetes? (B) What has your doctor told you to do to manage/control your diabetes better? (C) Do you always take your pills or tablets as directed by your healthcare provider? (D) Do you always take your insulin as directed by your healthcare provider?
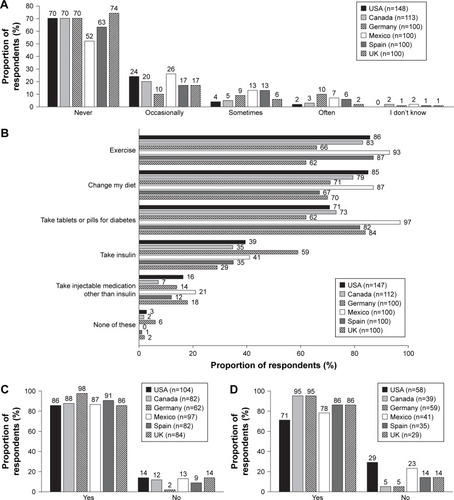
Figure 4 Participant perceptions of diabetes medications.
Notes: Responses to survey questions. (A) How burdensome would you say it is to take your injectable medication for your type 2 diabetes? (B) How important are medicines in helping you achieve your diabetes goals?
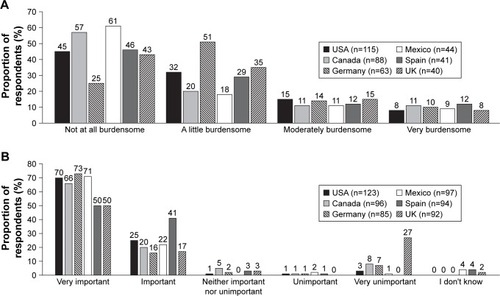
Figure 5 Participant attitudes toward diabetes self-management.
Notes: Responses to survey statements. (A) I am confident that I can avoid serious problems due to low blood sugar when I am alone. (B) I spend so much time worrying about the possibility of a low blood sugar episode that it interferes with my ability to do the things I really want to do. (C) To avoid serious problems with low blood sugar, I tend to keep my blood sugars higher than I probably should.
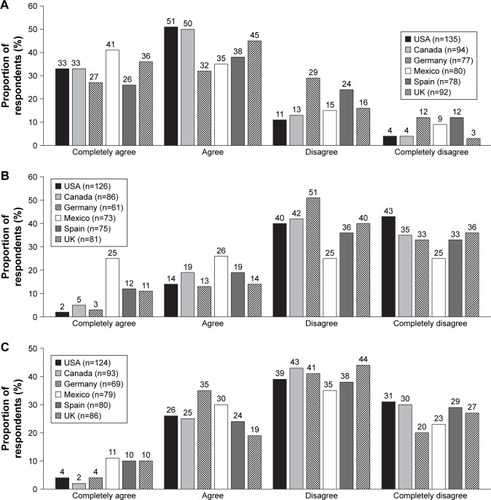
Table 3 Participant scores for the Regimen-Related Distress domain of the Diabetes Distress Scale