
Figures & data
Table 1 Demographic data by country
Figure 1 Graph showing the degree of patients’ acceptance to each type of bone graft.
Abbreviations: EDS, extraoral donor site; IDS, intraoral donor site.
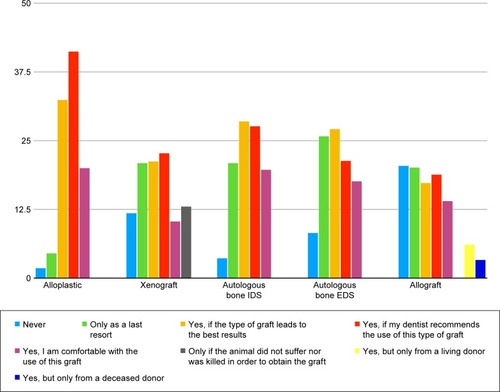
Table 2 Percentages of patients’ acceptance to each type of bone graft
Table 3 Reasons for rejection to each type of bone graft, by country