Figures & data
Table 1 Demographic characteristics of doctors and univariate analysis of DDPRQ-10 scores
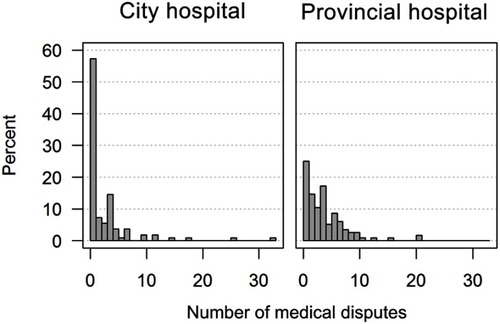
Table 2 Demographic characteristics of patients and univariate analysis of PDR-9 scores
Table 3 Adjusted coefficients for DDPRQ-10 scores from linear regression
Table 4 Adjusted coefficients for PDRQ-9 scores from linear regression
![Figure S1 Directed acyclic graph linking difficult doctor–patient relationship as experienced by doctors, sociodemographic and other potentially related variables. In this graph, difficult doctor–patient relationship is shown as the outcome of interest and the work time as the main exposure. For direct effect, age, clinic, coordination, hospital type, media, patient number, prescribe, and trust arepotential confounders. Medical dispute and pressure are intermediate variables.](/cms/asset/384f7345-f7f1-485c-ab25-37fbc4c7c152/dppa_a_12178236_sf0001_c.jpg)
![Figure S2 Directed acyclic graph linking patient–doctor relationship as experienced by patients, sociodemographic and other potentially related variables. In this graph, patient–doctor relationship is shown as the outcome of interest and the hospital type as the main exposure. Department is a potential confounder. Environment, wait time, and consultation time are intermediate variables.](/cms/asset/2211e370-2b12-4b49-af5c-f5f9870609ee/dppa_a_12178236_sf0002_c.jpg)