Figures & data
Figure 1 Timeline of macro-level medication non-adherence costs. Gray literature reports data demonstrating the increasing costs associated with medication non-adherence over time.

Figure 2 Derivation of the cost of medication non-adherence.
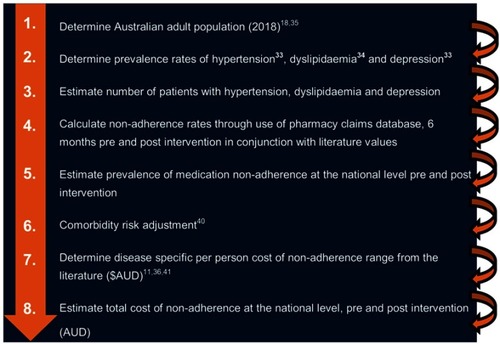
Table 1 Derivation of cost process. Outlines data input values to determine the national cost estimate of medication non-adherence in Australia
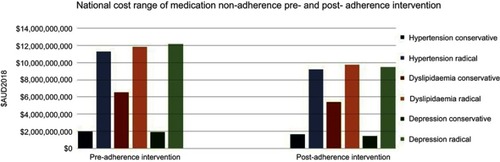
Figure 3 National cost range of medication non-adherence pre and post-adherence intervention. Bars represent the conservative and radical cost associated with medication non-adherence across three chronic conditions hypertension, dyslipidemia and depression. Chart comparison demonstrates Australian national cost range pre and post-community pharmacist-led medication adherence intervention.