
Figures & data
Figure 1 Frequency of missed doses by number of missed doses.
Note: Frequency, number of patients with m missed doses (in total) divided by total patient N (555), is graphed against the number of missed doses, m, for the 30-day period.
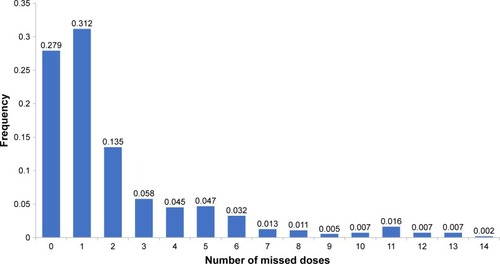
Figure 2 Proportion of patients with ≥2, ≥3, or ≥4 consecutively missed doses by number of missed doses.
Notes: Shown are the observed frequencies (“observed”) of ≥2, ≥3, and ≥4 consecutively missed doses (upper, middle, and lower panels) in patients with missed doses. The distributions of observed frequencies (“observed”) and theoretical random distribution (“calculated”) patterns are compared. The “observed” data represent the 555 HIV patients during the 30-day observation period. The “calculated” data assume that the missed doses were distributed randomly during the 30-day period and were computed as described.Citation6 The denominator is the number of patients with m missed doses, and the numerator is number of patients with ≥2, ≥3, or ≥4 consecutively missed doses for each value of m. P-values for comparison of observed and calculated distributions of ≥2, ≥3, and ≥4 consecutively missed doses, 0.345, <0.01, and <0.01, respectively.
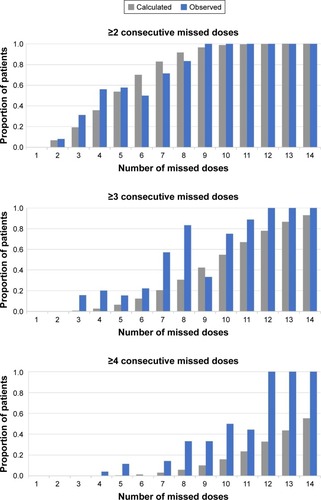
Table 1 Number of patients with missed doses