Figures & data
Figure 1 Overview of study procedures.
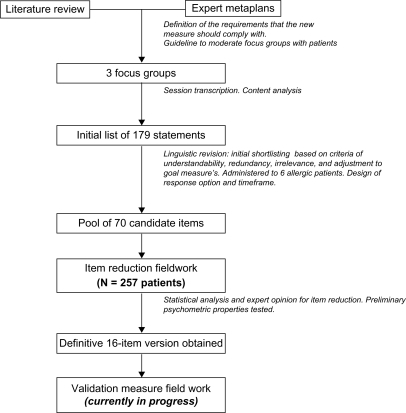
Table 1 Demographic and disease characteristics of patients involved in quantitative item reduction (n = 257)
Figure 2 Items eliminated at different stages of the item reduction process.
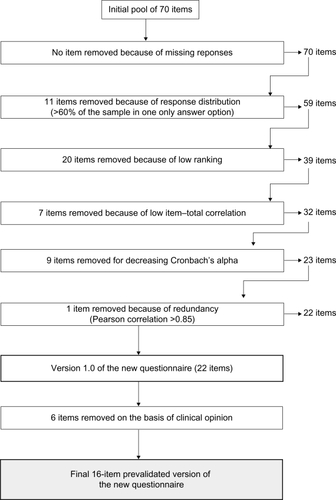
Table 2 Highest scoring items of the original 70 items (n = 254)
Table 3 Factor analysis for the 16 retained items of the new questionnaire (n = 254)Table Footnotea
Table 4 Score distributions, floor/ceiling effects, interscale correlations and internal consistency of the 16-retained items (n = 254)
Table 5 Mean (SD) of the 16-retained itemsTable Footnotea, based on symptomatic manifestations of allergy (n = 254)