Figures & data
Figure 1 Flow chart of the factors for patient satisfaction.
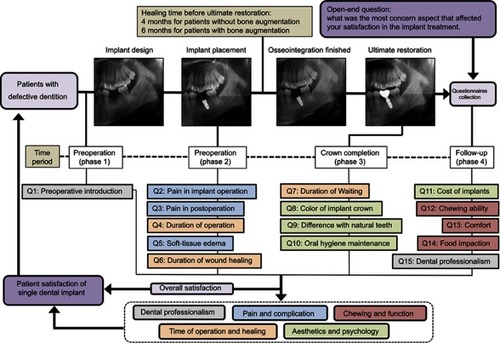
Table 1 Demographic variables studied according to simple count
Table 2 Oral implant impact profile questionnaire pertaining to satisfaction score with various aspects of implants (n=373)
Table 3 Overall satisfaction score (questionnaire) of patients
Figure 2 The differences in the bone augmentation group and the period of teeth loss group. (A) Implant placement with (a, b, c) or without (d, e) bone augmentation. (B) Typical X-ray pictures of the period of teeth loss in different patients: (f) the period of teeth loss was less than 1 year; (g) the period of teeth loss was 1–2 years, there was a tilting of adjacent teeth; and (h) the period of teeth loss was more than 2 years, elongation of paired jaw teeth, tilting of adjacent teeth, and insufficient repair space are obviously shown.
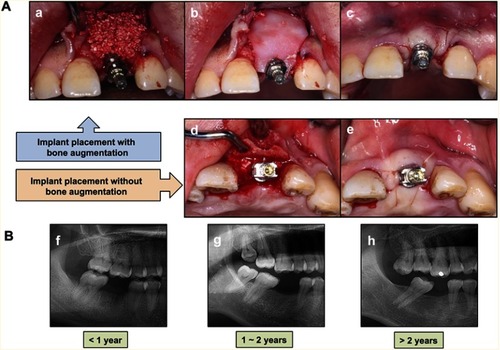
Table 4 Elements of satisfaction score analysis for bone augmentation and period of teeth loss variables
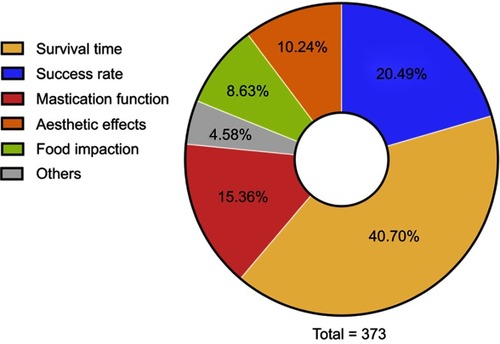
Figure 3 The distribution of responses to the open-ended question. The open-ended question at the bottom of the OIIP-Q was “what was the most concern aspect that affected your satisfaction in the implant treatment?” N=373.