Figures & data
Table 1 DCE attributes and levels
Table 2 An example discrete choice task. Please consider the following two cervical cancer screening scenarios and let us know your preference by ticking the corresponding box. Will you actually participate in the screening program you chose if it was offered to you?
Table 3 Demographic characteristics of participants
Table 4 Main effects model for DCE (n=348)
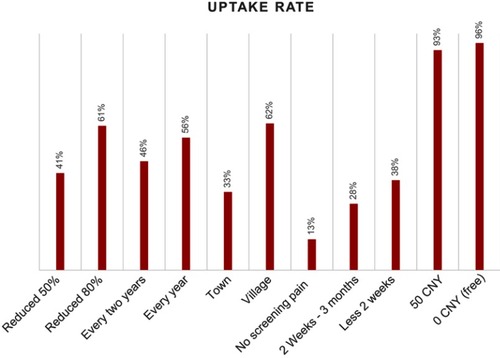
Figure 1 Simulated probability for cervical cancer screening under various potential policy scenarios. Baseline cervical cancer screening program: the percentage of cervical cancer-related death reduction “20%”; screening location “county”; screening interval “every three years”; moderate screening pain; waiting time for screening results “3 months – 6 months”; out-of-pocket cost “300 CNY”.