Figures & data
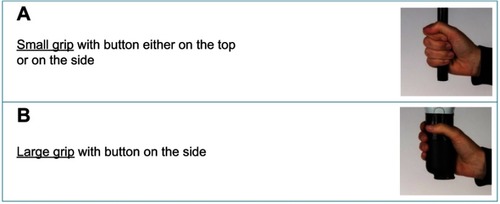
Figure 1 Example DCE question. The final experimental design included 40 sets of 3 devices split into 4 blocks of 10 hypothetical choice questions. Patients were randomly assigned to 1 block of 10 questions. Questions were randomly ordered to avoid ordering effects.
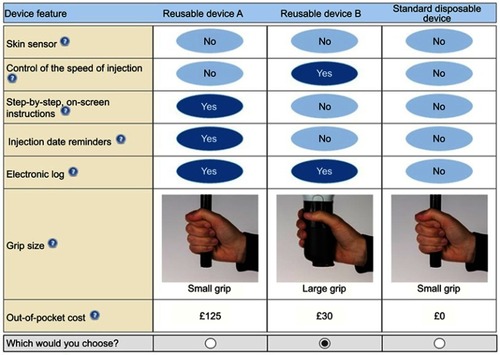
Table 1 Patient demographics, all patients (N=323)
Table 2 Respondent demographics by condition subgroup (N=323)
Table 3 Patients stratified by disease indication
Table 4 Random parameters logit estimates (N=323)
Table 5 Random parameters logit regression results: condition subgroups (N=323)
Table 6 Random parameters logit regression results: disease severity subgroups (N=323)
Table 7 Random parameters logit regression results: self-injection experience subgroups (N=323)
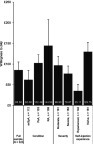
Figure 2 Total population willingness to pay for each enhanced feature (N=323).
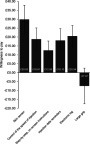
Figure 3 Population subgroup willingness to pay for each enhanced feature. (A) Willingness to pay for each enhanced feature by condition; (B) Willingness to pay for each enhanced feature by disease severity; (C) Willingness to pay to each enhanced feature by self-injection experience.
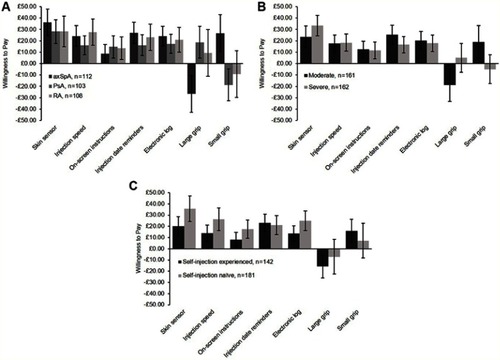
Figure 4 Sample and subgroup valuation of an enhanced, reusable self-injection device with all enhanced features and large grip compared to a standard disposable device (N=323). A standard disposable self-injection device has no features, small grip, and no out-of-pocket cost associated with it.