
Figures & data
Figure 1 Research model.
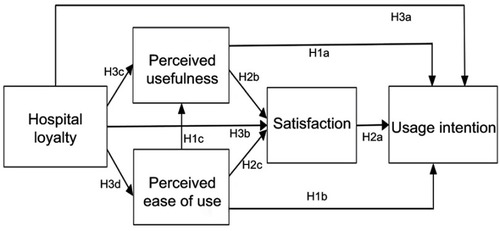
Figure 2 Mobile app design – (A) assessment of behavioral and menstrual status; (B) calendar function; (C) data storage (The content of this interface has been translated into English; the original interface is in Chinese.).
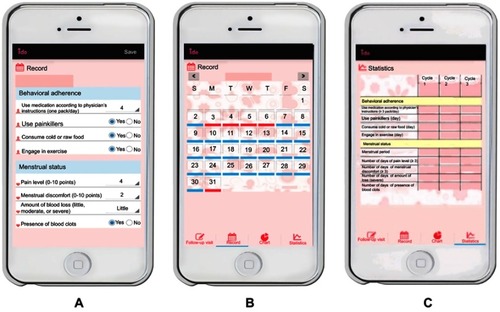
Table 1 Cronbach’s α, factor loadings, and explained variance of the study variables
Table 2 Demographic characteristics
Figure 3 Measurement model composed of five latent variables tested through confirmatory factor analysis. All the correlations were statistically significant.
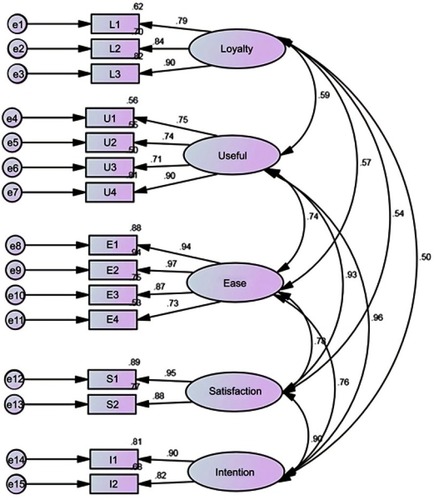
Table 3 Standardized path coefficients for the full and parsimony models
Table 4 Standardized direct and indirect effects on usage intention of mobile app (parsimony model)
Figure 4 Structural equation modeling analysis of the research model (full model). The dotted line represents a nonsignificant relationship. *p<0.05.
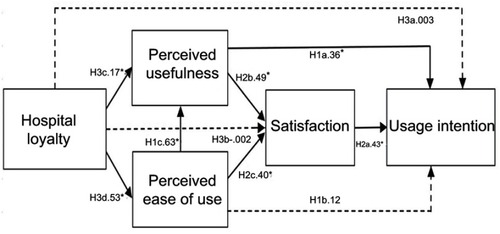
Table S1 Study variables and corresponding items