
Figures & data
Figure 1 Conceptual model of the relationships between the general perceived well-being as the outcome variable and the oral-specific well-being, dental-specific anxiety, and self-esteem, as the predictor variables (the arrows represent the hypothesized directions of influence and the plus/minus sign designates the positive/negative association).
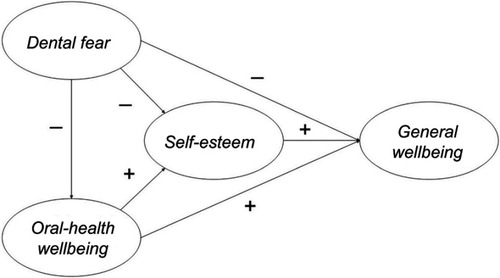
Table 1 Scales’ items
Table 2 Item loadings
Figure 2 Final pathway model of the relationships between the general perceived well-being as the outcome variable and the oral-specific well-being, dental-specific anxiety, and self-esteem, as the predictor variables (the dotted pathways marked “n.s.” indicate nonsignificant relationships).
Abbreviations: SES, self-esteem; DFS, Dental Fear Survey; OHIP, Oral Health Impact Profile; FLS, Flourishing Scale.
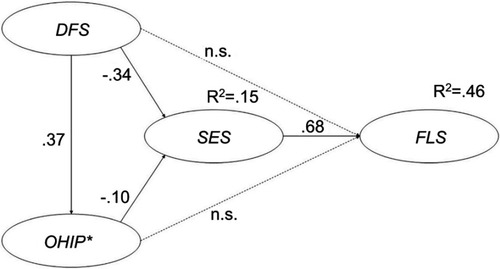
Table 3 Construct validity and reliability
Table 4 Fit indices for the pathway model