
Figures & data
Table 1 Baseline characteristics
Figure 1 Sample patient profile (HPI).
Abbreviation: HPI, high agency/positive emotion/internal control.
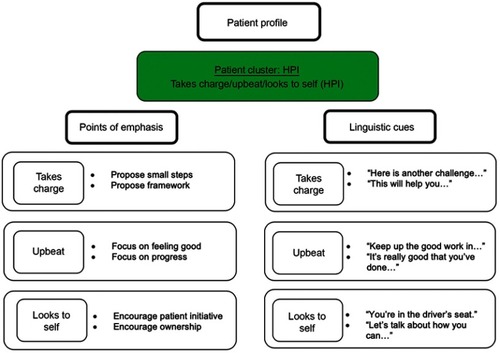
Figure 2 Sample patient profile (LNE).
Abbreviation: LNE, low agency/negative emotion/external control.
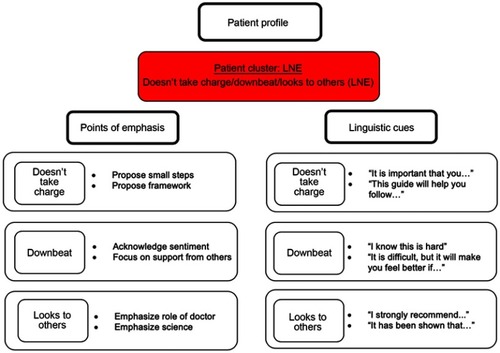
Table 2 Regression output with HbA1c change as dependent variable