
Figures & data
Table 1 Demographics of respondents in the survey and comparison with the general population
Figure 1 The distribution of PEI score and EQ-5D utility.
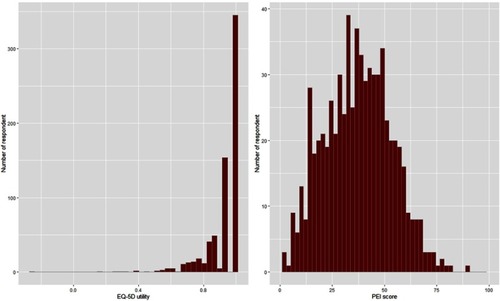
Figure 2 The boxplot of PEI score and EQ-5D utility based on sex and educational level.
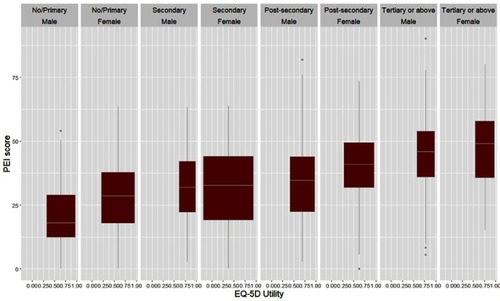
Table 2 The PEI score and EQ-5D utility based on demographic characteristics
Table 3 The mean score of PEI of different dimensions on different levels of EQ-5D dimension
Table 4 Regression analyses of patient engagement and EQ-5D and all socio-demographic variables