Figures & data
Figure 1 An example of the applied choice sets. The DCE card shows two different hypothetical APP alternatives derived from a combination of the defined attributes and the respective levels. Physicians needed to decide between option A, B or an opt-out option.
Notes: The figure shows one choice set as presented to participating physicians. All in all, physicians were asked to decide on 16 different choice sets.
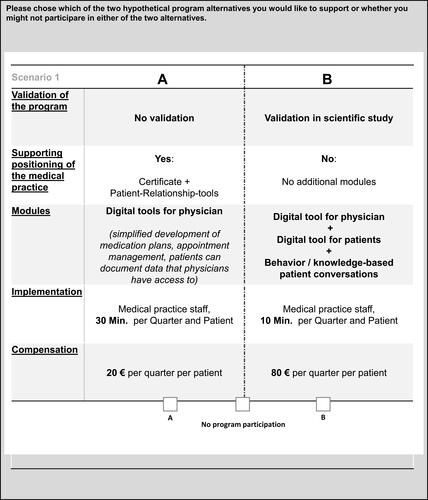
Table 1 Characteristics of Interviewed Physicians
Table 2 Logistic Regression Exploring the Probability to Choose the Opt-Out Option
Figure 2 The results of the conditional logit estimation based on 222 physicians. For each attribute describing alternative APP options, its relative importance for overall (hypothetical) physicians’ decisions for/against a specific APP is reported in % (light grey areas). Furthermore, utility per attribute level including significance of utility differences in comparison to the reference attribute level is shown (black bars).
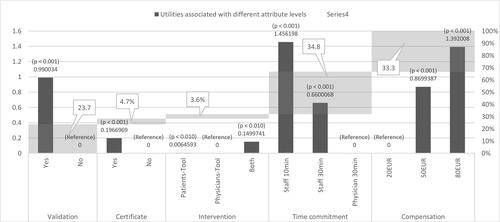
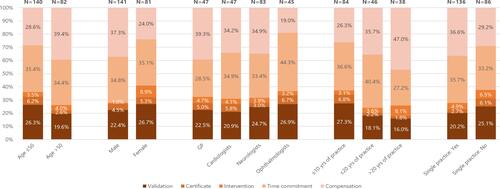
Figure 3 The relative importance of the different attributes across subgroups.