
Figures & data
Table 1 Attributes And Their Levels
Figure 1 Sample of DCE survey question.
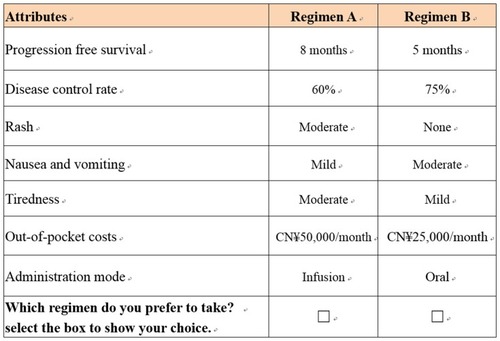
Table 2 Demographic Characteristics Of The Study Sample
Table 3 Main Effects Mixed Parameter Logit Model Results
Figure 2 Patient preferences intensity.
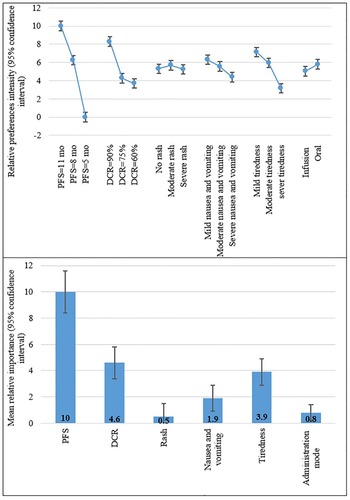
Table 4 Variation In Patient Preferences For NSCLC Treatment
Table 5 Patients’ Marginal WTP For Each Attribute Level