Figures & data
Table 1 Different Situations in Discrete Choice Experiment
Figure 1 Expected utility of a doctor’s advice to a patient with a true disease risk of P.
Abbreviations: P, probability of disease; U, utility.
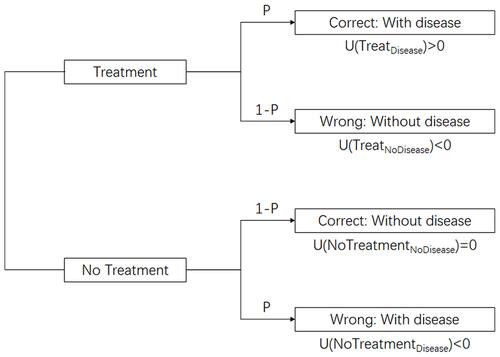
Table 2 The Probabilities of Each Diagnostic Result
Figure 2 Differences in the weight of probability P between the classical economics and prospect theories.
Notes: In the classical economics theory, the weight of probability P is equal to the P value (red line); however, in the prospect theory, if the P is slight (assume 0), the weight will be higher than the P in value (blue or yellow lines); however, if P is large (assume 100%), the weight will be lower than the P value (blue or yellow lines). It should be noted that the curve of the weight of P according to the prospect theory is not unique. The curves are suitable for the patient’s estimation of true disease risk, diagnostic sensitivity, and diagnostic specificity.
Abbreviation: P, probability of disease.
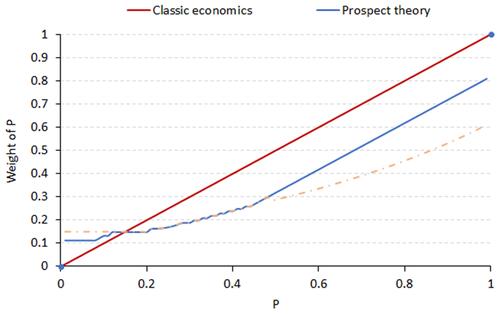
Figure 3 Differences in therapy coefficients with increasing disease risk between the classical economics and prospect theories.
Notes: Because of the differences shown in , the difference in the weight of P will cause a bias from TC to TCb. Assuming the other parameters are the same between TC and TCb, the difference in the weight of P will cause a dramatic decrease from TC (red line) to TCb (blue or yellow lines) if P is large (assume 100%); it will also cause an increase from TC to TCb if P is small (assume 0). Therefore, an ordinary patient may disregard the recommended therapy if they are diagnosed with a common disease; at the same time, they may be too worried about the diagnosis of a rare disease.
Abbreviations: P, probability of disease; TC, therapy coefficient; TCb, biased therapy coefficient.
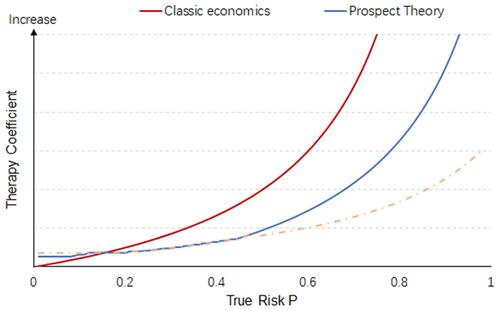
Figure 4 Differences in therapy coefficients with increasing diagnostic sensitivity between classical economics and prospect theories (assuming a fixed diagnostic specificity of 0.9).
Notes: Because of the difference shown in , differences in the weight of P will cause a bias from TC to TCb. In clinical practice, diagnostic tests have moderate to high accuracy; therefore, we focus only on the right part of the curves (for example, where the sensitivity is greater than 0.6, the red dotted box in the Figure). Assuming the other parameters are the same between in TC and in TCb, an increase in diagnostic sensitivity will cause an increase in the TC (red line) and TCb (blue or yellow lines). It should be noted that the gap between the TC and TCb is highly associated with the gap in the weight of the sensitivity. Therefore, an increase in diagnostic sensitivity alone may not improve patient adherence. In extreme cases, if a doctor has been informed of an increase in sensitivity while the patient remains unaware, the gap will increase and patient adherence may decrease.
Abbreviations: P, probability of disease; TC, therapy coefficient; TCb, biased therapy coefficient.
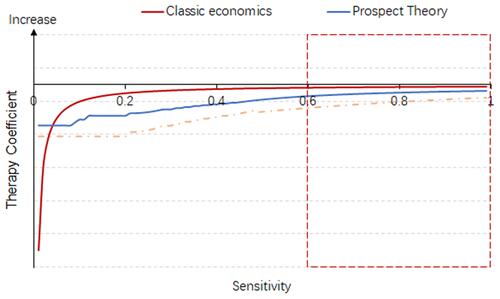
Figure 5 Differences in therapy coefficients with increasing diagnostic specificity between the classical economics and prospect theories (assuming a fixed diagnostic sensitivity of 0.9).
Notes: Since in clinical practice, diagnostic tests generally have moderate to high accuracy, we focus only on the right part of the curves (for example, specificity above than 0.6, the red dotted box in the Figure). Similar to the increase in diagnostic sensitivity, assuming that the other parameters are the same between TC and in TCb, an increase in diagnostic specificity may cause an increase in TC (red line) and TCb (blue or yellow lines). The gap is also associated with a gap in the weight of the specificity. Therefore, an increase in diagnostic specificity alone may not help to improve patient adherence. In extreme cases, if a doctor has been informed of the increase while the patient has not, the gap will increase and patient adherence may decrease.
Abbreviations: P, probability of disease; TC, therapy coefficient; TCb, biased therapy coefficient.
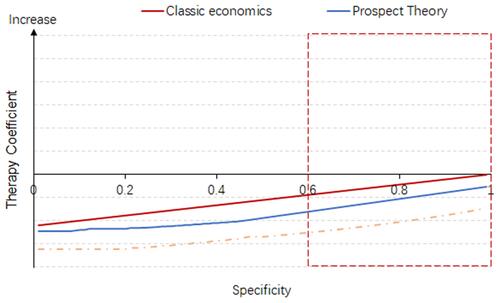
Figure 6 Differences in treatment utility between the classical economics and prospect theories.
Notes: According to the classical economics theory, the absolute value of the utility increase caused by the therapeutic effects is equal to the absolute value of the utility decrease caused by side effects. However, in the prospect theory, the absolute value of the utility increase caused by the therapeutic effects is much lower than the absolute value of the utility decrease caused by the side effects. Therefore, side effects may have more impact on TCb.
Abbreviation: TCb, biased therapy coefficient.
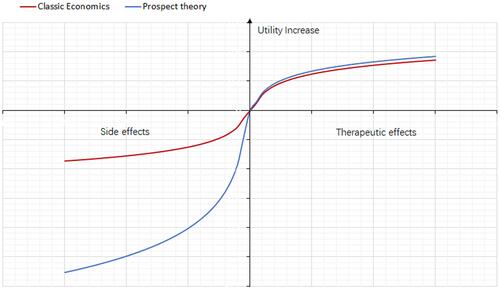
Figure 7 Trends in therapy coefficients with increasing therapeutic effects (assuming the side effect of the therapy is always one unit).
Notes: According to the classical economics theory, increasing therapeutic effects will cause a dramatic increase in the therapy coefficient (red line), while increase is much lower in the prospect theory (blue line). Therefore, doctors should understand that their patients may not be as excited about advanced therapy as they are.
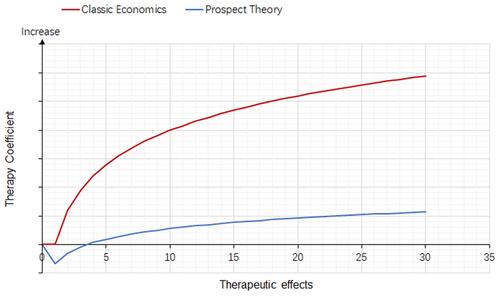
Figure 8 Trend in the therapy coefficient with increasing side effects (assuming a therapeutic effect of one unit).
Notes: According to both classic theories, increased side effects will cause a decrease in the therapy coefficient (red and blue lines); however, the degree of decrease is larger in the prospect theory (blue line). Therefore, doctors should understand that their patients may be excessively concerned about the side effects of the therapy.
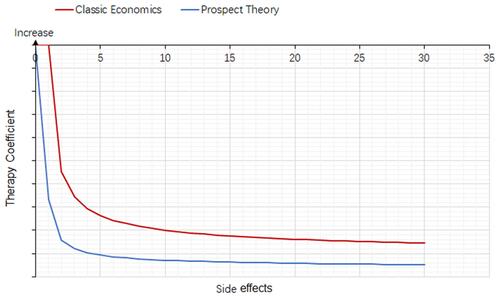
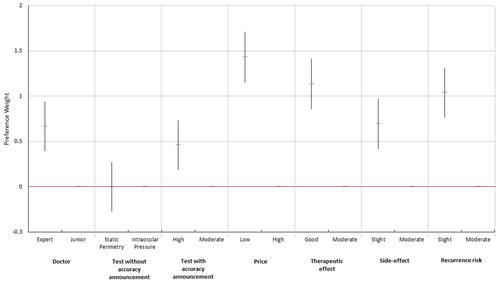
Figure 9 Preference weight of patient adherence for the conditional logit model (dummy-coded).