
Figures & data
Table 1 Gender and Age Distribution, Data are Presented as Percent of Total Respondents
Figure 1 Medications and conditions prior to first CDI. (A) Distribution of participants that took antibiotics prior to diagnosis, and (B) health professional who prescribed the antibiotics. (C) Accompanying situations at the time of C. difficile infection and (D) concurrent gastrointestinal conditions.
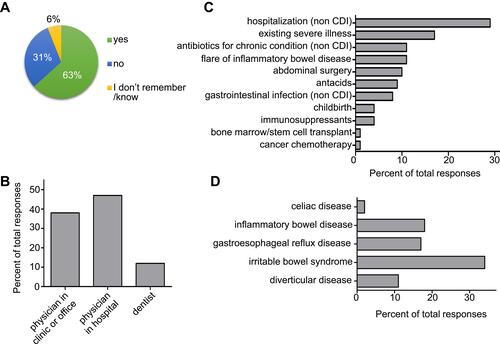
Figure 2 Situations surrounding first C. difficile infection. (A) Exposure to health-care facilities and travel preceding development of first symptoms. (B) Length of hospital stay because of first C. difficile infection.
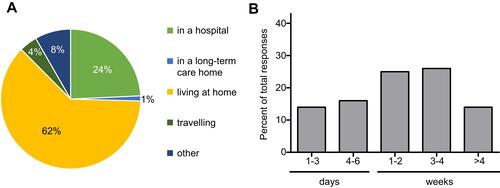
Figure 3 Symptoms and recurrence. Symptoms and complications experienced with CDI, (A) symptoms as percent of total responses and (B) number of symptoms experienced per individual as percent of total responses. (C) Recurrence of C. difficile infection compared to (D) reinfection with C. difficile and (E) number of C. difficile reinfections per respondent.
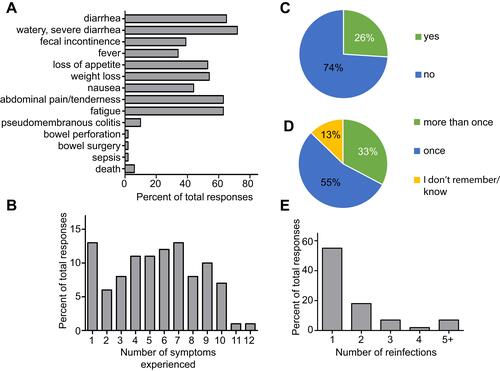
Figure 4 Diagnosis and treatment. (A) Time between onset of symptoms and diagnosis and (B) time between commencement of treatment and symptom resolution, or no resolution (NR). Antibiotic (abx), probiotic (pbx) or combination (abx+pbx) treatment used to overcome first (C) and any subsequent (D) C. difficile infections.
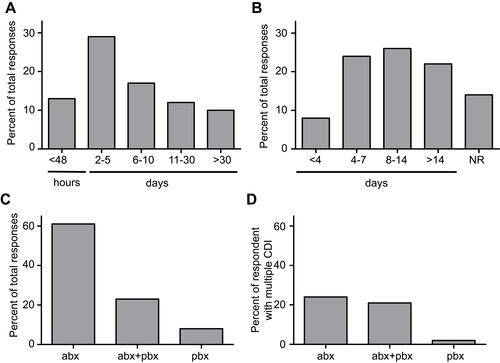
Table 2 Survey Qualifiers to Query Quality of Life Scores
Figure 5 Impact of C. difficile infection on quality of life, data separated by (A) patient and (B) caregiver response. Data presented as violin plot of individual survey responses. Thickness of plot corresponds to number of responses whereas all responses are plotted.
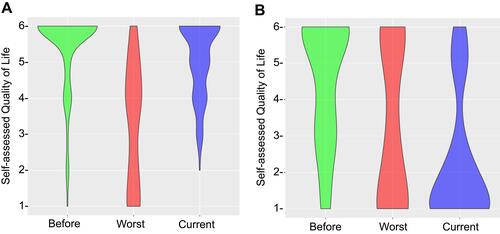
Table 3 Emerging Themes and Distribution of Responses. Data Presented as Percentages of Respondents Who Answered to Open-Ended Questions (104 Total Responses) and Percentage of Themes