
Figures & data
Table 1 Characteristics of the Patients
Figure 1 Patient flowchart.
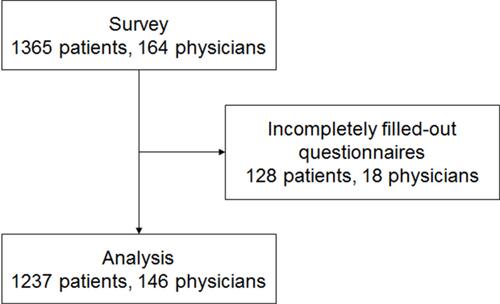
Table 2 TSQM-II Summary Scores
Figure 2 Radar charts with items for patients and physicians, showing satisfaction with biological disease-modifying antirheumatic drugs. P<0.05 in question (Q) 3, Q4, Q5, Q7, and Q8.
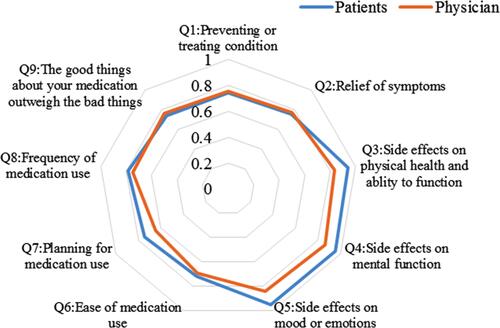
Figure 3 Radar charts with items for physicians, showing satisfaction with biological disease-modifying antirheumatic drugs (bDMARDs) and conventional synthetic DMARDs (csDMARDs). P<0.05 in question (Q) 1, Q2, Q3, Q4, Q5, and Q9.
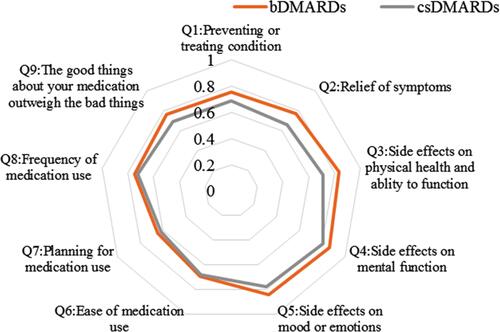
Table 3 Factors Influencing the Patients’ Satisfaction with All Medications, Detected Using Multivariable Linear Regression Analysis
Table 4 Factors Influencing the Patients’ Satisfaction with bDMARDs, Detected Using Multivariable Linear Regression Analysis