
Figures & data
Figure 1 Flowchart to show patient completion of the online survey.
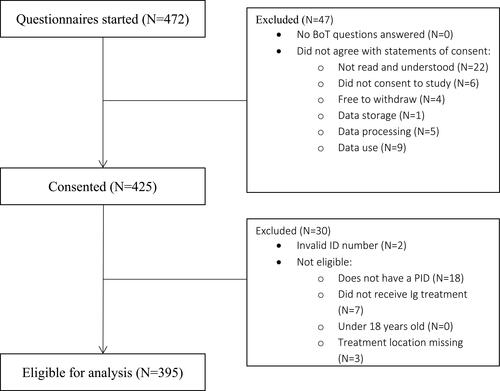
Table 1 Patient Characteristics by Ig Treatment Group
Table 2 Clinical Characteristics by Treatment Route
Table 3 Domain Structure, Item Pool and Reliability of the Domains Generated from the Exploratory Factor Analysis
Table 4 Raw Data of the IgBoT-35 Items
Table 5 Mean Domain Scores for the IgBoT-35 for the Total Patient Sample
Table 6 Domain Summary Statistics by Administration Route (IVIG/SCIG)
Table 7 Domain Summary Statistics by Gender (Female/Male)
Table 8 Domain Summary Statistics by Age Group (<60/≥60)
Table 9 IgBoT-35 Domain Values by Location (Home versus Hospital Treatment)