Figures & data

Table 1 Characteristics of Ischemic Stroke Patients
Table 2 An Unadjusted Comparison of the Perception of Illness and Medication Beliefs According to Medication Adherence
Table 3 Adjusted Comparison of Perception of Illness and Medication Beliefs According to Medication Adherence
Table 4 Correlation Matrix for the Different Scales Used to Test BMQ, BIPQ, and MARS. Pearson Correlation Coefficient (p-value)
Table 5 The Effect of Medication Belief Mediators (M) in the Association Between the Perception of Illness (X) and Medication Adherence (Y)
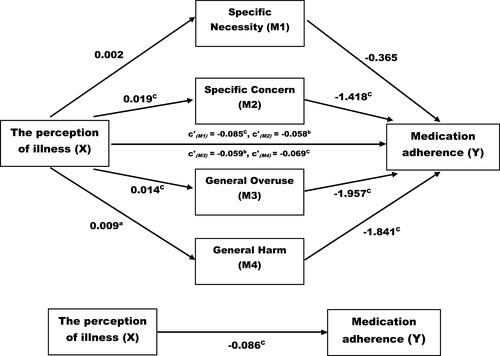
Figure 1 The effect of medication belief mediators (M) in the association between the perception of illness (X) and medication adherence (Y).
Note: Coefficients were adjusted for age, sex, The National Institute of Health Stroke Scale (NIHSS), education, occupation, duration of disease, and payment methods using the bootstrapping method. aP < 0.05; bP < 0.01; cP < 0.001. c’, a direct effect of X on Y.