Figures & data
Table 1 DCE Attributes and Attribute Levels
Figure 1 Example choice card.
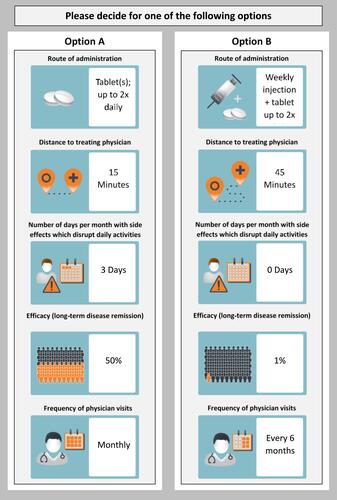
Table 2 Sociodemographic and Clinical Characteristics of Patients
Table 3 Estimated Conditional Logit Regression Model for the Entire Sample and Subgroups of Patients
Figure 2 Relative importance of each attribute for patients’ hypothetical treatment choices (entire sample and 6 subgroups).
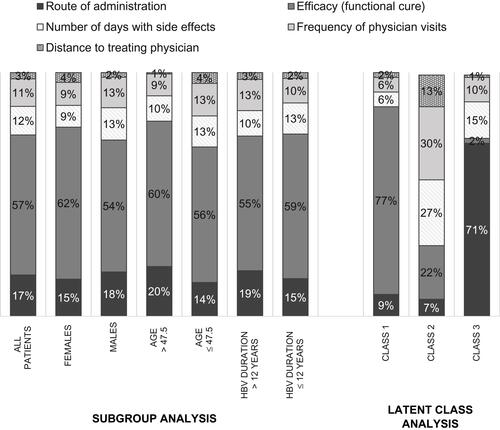
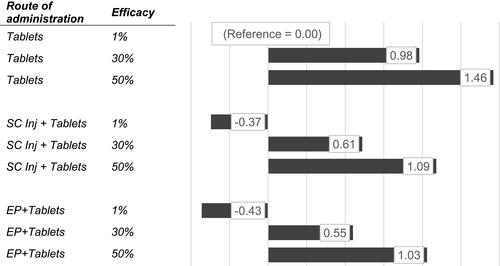
Figure 3 Relative utility associated with different treatment options (fixed attribute levels: 1 day with side effects, half-yearly physician visits, 15 mins of travel time to physician).