Figures & data
Figure 1 Example of r-hGH injection and device descriptions.
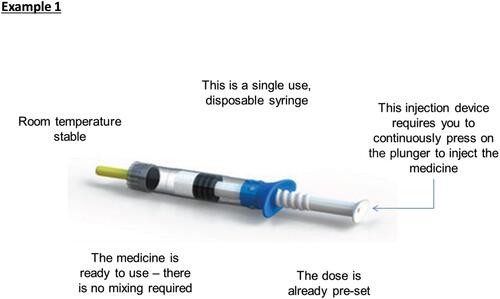
Table 1 Attribute and Level Grid
Table 2 Fixed Attribute Grid Profiles for Hypothetical Products X, Y, Z
Figure 2 Example discrete choice experiment question.
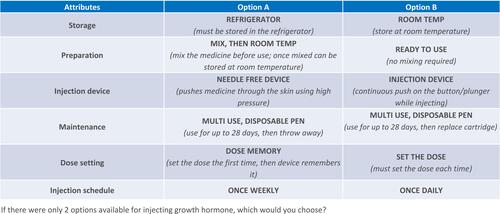
Table 3 Patient Characteristics
Table 4 Caregiver Characteristics (Caregivers of Patients 3–18 Years [N=149])
Figure 3 Average relative importance of attributes. Base: All patients (Total weighted, n=224).
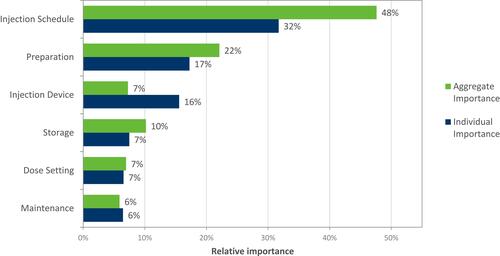
Figure 4 Average relative importance of attributes by patient cohort. Base: All patients (Total weighted, Adult, n=75; Adolescent Dyad, n=79; Pediatric Dyad, n=70).
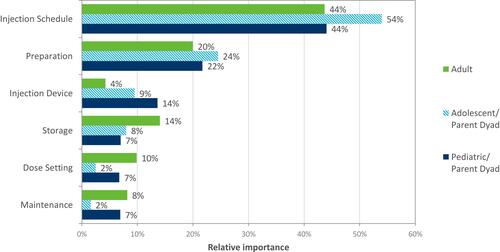
Figure 5 Average relative utility of injection schedule attribute. Base: All patients (Total weighted, n=224).
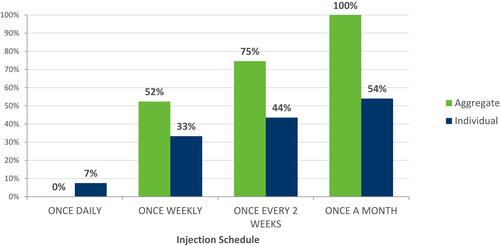
Figure 6 Average relative utility of preparation attribute. Base: All patients (Total weighted, n=224).
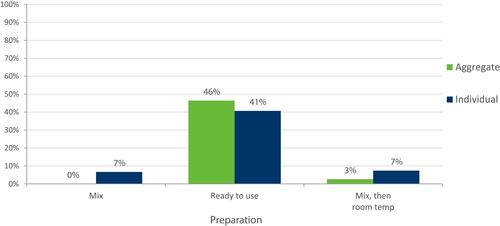
Figure 7 Average relative utility of injection device attribute. Base: All patients (Total weighted, n=224).
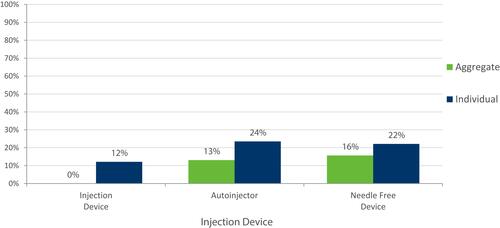
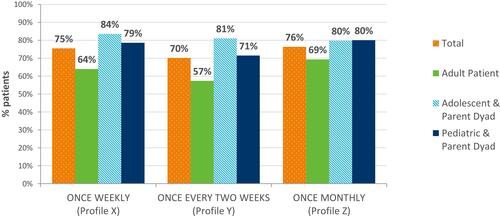
Figure 8 Percentage of participants that would choose the new profile over current treatment. Base: All patients (Total weighted, n=224; Adult, n=75; Adolescent Dyad, n=79; Pediatric Dyad, n=70).