
Figures & data
Table 1 Baseline Characteristics (N=500)
Figure 1 Compliance at each follow-up visit for patients with non-missing compliance data only.
Notes: (A) The median percentage of injections completed by patients using BETACONNECT®. (B) Percentage of patients that completed ≥80% of scheduled BETACONNECT injections.
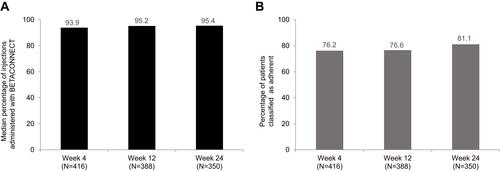
Table 2 Logistic Regression Results for Compliance and Adherence
Table 3 Satisfaction with the Patient’s Previous Injection Method and BETACONNECT® Across Visits
Table 4 Secondary Outcome Measures