Figures & data
Table 1 Attributes and Levels of the Discrete Choice Experiment
Figure 1 Example discrete choice experiment question (English-language version).
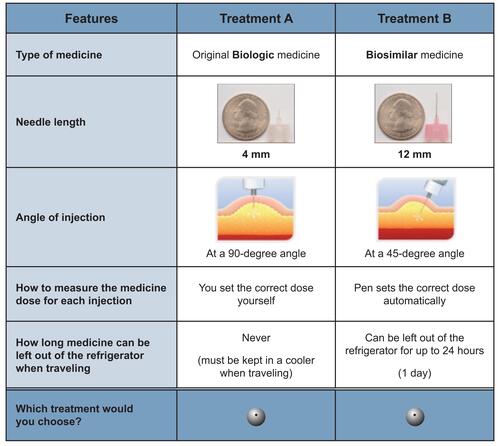
Table 2 Respondent Characteristics and Comparison Between Respondents Intercepted in Person and Respondents Recruited Through the Online Panel (Fisher Exact Test)
Table 3 Mean Coefficients from the Random Parameters Logit Model Estimates for the Full Sample (N = 200)
Figure 2 Conditional relative attribute importance computed for the full sample (N = 200).
Note: The graphic shows the conditional relative importance estimate for each attribute, scaled such that the attribute with the highest conditional relative importance—type of osteoporosis medicine—is set to 10, and the conditional importance of each of the other attributes is scaled relative to the conditional importance of the attribute with the highest conditional relative importance. The vertical bars surrounding each relative importance weight estimate denote the 95% confidence interval (computed using the delta method).
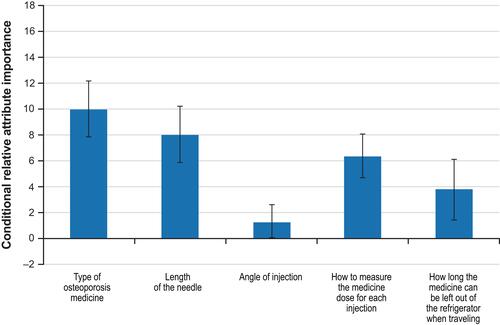
Figure 3 Conditional relative attribute importance comparing data from respondents recruited online and in person (N = 200).
Note: The vertical bars surrounding each relative importance weight estimate denote the 95% confidence interval (computed using the delta method).
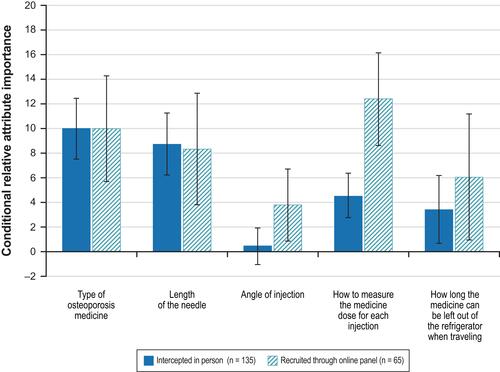
Table 4 Descriptions of the Subgroups Analyzed (N = 200)
Figure 4 Conditional relative attribute importance for the subgroup analysis based on employment status (N = 200).
Note: The vertical bars surrounding each relative importance weight estimate denote the 95% confidence interval (computed using the delta method).
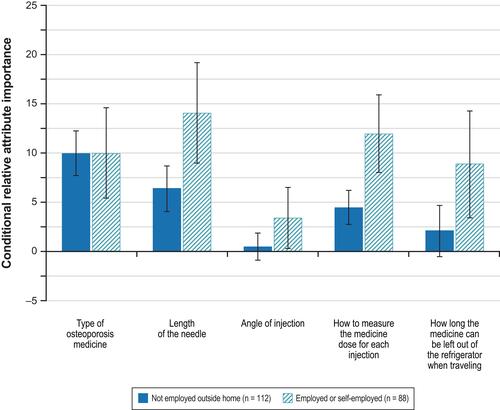
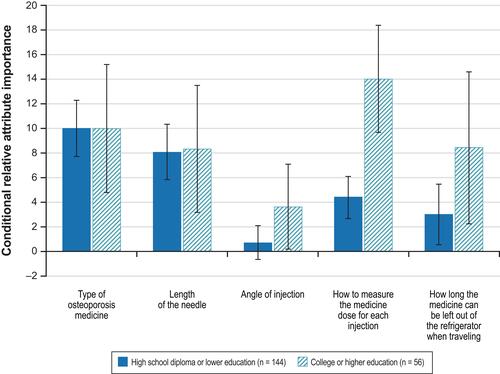
Figure 5 Conditional relative attribute importance for the subgroup analysis based on level of education (N = 200).
Note: The vertical bars surrounding each relative importance weight estimate denote the 95% confidence interval (computed using the delta method).