Figures & data
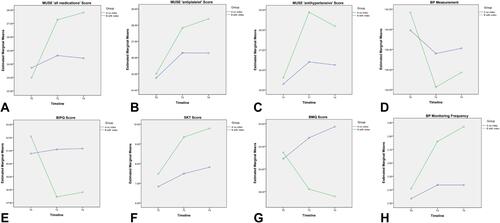
Figure 1 Flowchart of the trial. **Patients available for analysis. Nevertheless, intention-to-treat analysis (ITT) was undertaken. Therefore, finalized number of patients for analysis were 108 of them from each group.
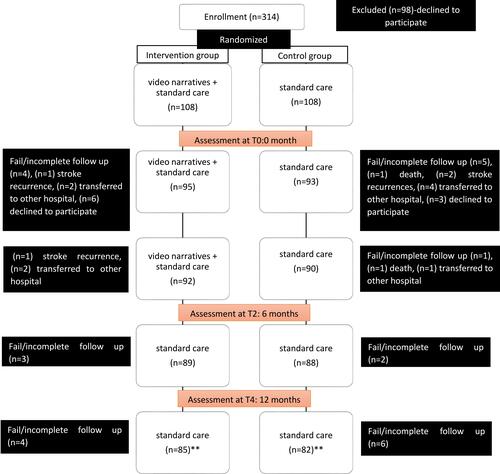
Table 1 Socio-Demographic Data of Patients at Baseline (n=216)
Table 2 Groups’ Comparison at Various Timelines
Table 3 Pair Wise Comparison Between Timelines (T0, T2, T4)
Figure 2 Changes in mean score, measurement and frequency of outcome measures within timeline for control and intervention groups. (A) Changes in mean score of the medication understanding and use self-efficacy (MUSE) “all medications” within timeline. (B) Changes in mean score of the medication understanding and use self-efficacy (MUSE) “antiplatelet” within timeline. (C) Changes in mean score of the medication understanding and use self-efficacy (MUSE) “antihypertensive” within timeline. (D) Changes in the blood pressure (BP) measurement within timeline. (E) Changes in mean score of the brief illness and perception questionnaire (BIPQ) within timeline. (F) Changes in mean score of the stroke knowledge test (SKT) within timeline. (G) Changes in mean score of the belief about medicine questionnaire (BMQ) within timeline. (H) Changes in the blood pressure (BP) monitoring frequency within timeline.