Figures & data
Figure 1 Breakdown of negative PEM-MS reports regarding press-through packages (PTPs). As multiple problems were often included in one report, the sum is not equal to the total number of reports.
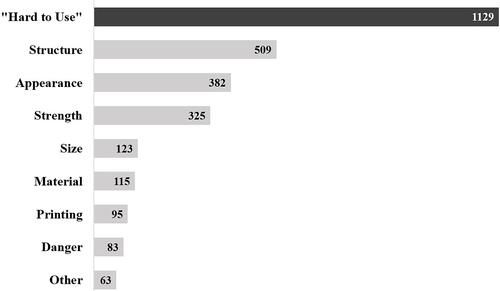
Figure 2 Measured thickness of PTP pockets.
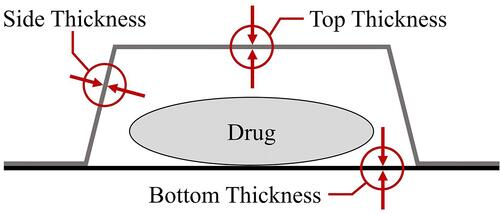
Figure 3 Parameters relating to the inside of PTP pockets.
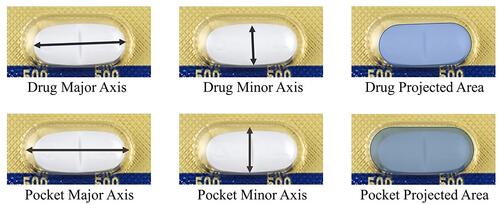
Figure 4 Measurement of press-out force. (A) (left): Base for measurement, (B) (right): Method of measurement.
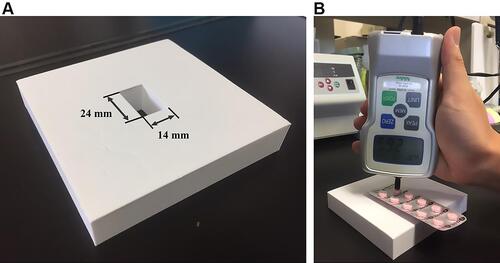
Table 1 Parameters Relating to the Inside of PTP Pockets
Table 2 Results of Logistic Regression
Table 3 Cross Table and Adjusted Residuals for PTP Materials
Table 4 Shapes of PTP Pocket Sections
Table 5 PTP Pocket Wall Thickness
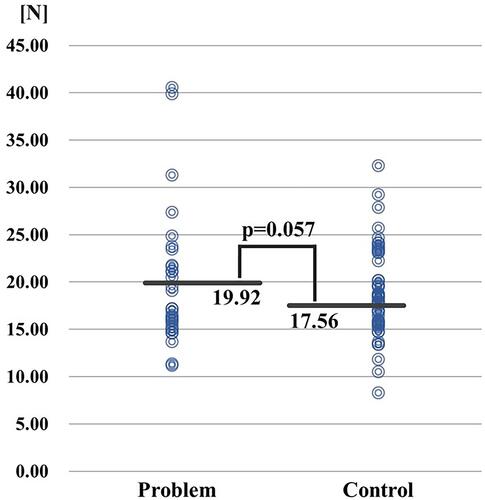
Figure 5 Distribution and mean value of press-out force in each group. n=31 (Problem), 89 (Control). Each dot represents the press-out force of a product. Bold bars indicate the mean values. The P value for the difference of the means is shown.