Figures & data
Table 1 Baseline univariate characteristics
Figure 1 Proportion of patients continuing olanzapine for 1 year. Most patients (68.2%, 1262/1850) continued with olanzapine treatment for the full 1-year study.
Note: The mean duration of olanzapine treatment was 265.5 ± 119.4 days.
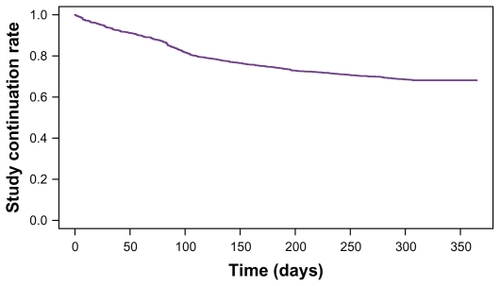
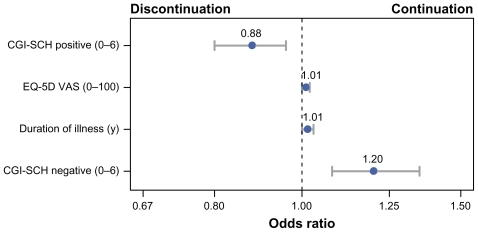
Figure 2 Significant predictors of treatment continuation in the stepwise logistic regression analysis. This figure presents the odds ratios and 95% confidence intervals for each of the predictors of continuation in the final stepwise logistic regression model. Each predictor in the final model was a continuous variable; therefore, the odds ratios represent the change in odds of continuation for every one-unit increase in the predictor variable.
Abbreviations: CGI-SCH, Clinical Global Impression-Schizophrenia; EQ-5D VAS, European Quality of Life 5-Dimensions Visual Analog Scale.