
Figures & data
Figure 1 Flowchart of study inclusion.
Abbreviations: CVD, cardiovascular disease; RCT, randomized controlled trial; CCT, clinical controlled trial.
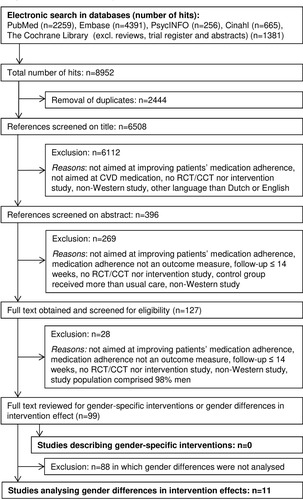
Table 1 Characteristics of Studies Describing Interventions for Which Subgroup Analyses are Performed to Investigate Gender Differences in Intervention Effects
Table 2 Adherence Outcomes and Measurement and Intervention Effects, Including Gender-Specific Results
Table 3 Risk of Bias of Included Studies Determined with the Cochrane Collaboration Tool for Assessing Risk of Bias. Seven Domains of Bias Were Scored Low (Green Dot), High (Red Dot) or Unclear Risk (Yellow Dot)