Figures & data

Table 1 Attributes and Levels
Figure 1 Example Choice Questions. (A) Patient Survey, Which treatment option would you choose? (B) Caregiver Survey, Which treatment option would you choose for your child?
Note: The choice tasks shown in these questions represent examples of DCE choices in questions from the survey. An experimental design determined the combination of attributes and levels for each hypothetical treatment and the pairs of hypothetical treatments shown in each question. The experimental design included a total of 36 DCE questions, which were used to create four blocks of nine DCE questions each. presents the full range of levels for each attribute.
Abbreviations: A1C, hemoglobin A1c; DCE, discrete-choice experiment.
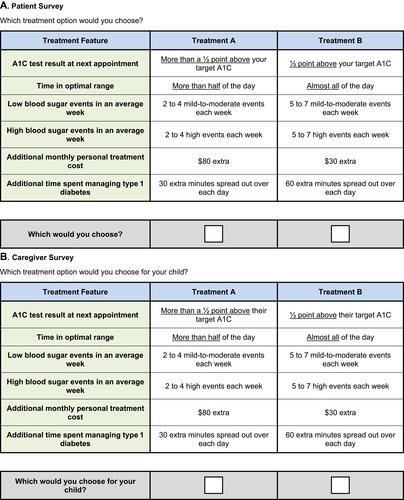
Figure 2 Preference Weights for (A) Adults With Type 1 Diabetes (N = 300) (B) Caregivers of Children With Type 1 Diabetes (N = 400); Attribute Relative Importance, From Most-Preferred Level to Least-Preferred Level, for (C) Adults With Type 1 Diabetes (N = 300) (D) Caregivers of Children With Type 1 Diabetes (N = 400).
Note: The vertical bars surrounding each mean preference weight and each relative importance weight denote the 95% confidence interval. A mild-to-moderate low blood sugar event was defined as blood sugar levels between 54 and 69 mg/dL and experiencing one or more early symptom(s) of low blood sugar, including shaking, heart palpitations, anxiety, sweating, and hunger. A serious low blood sugar event was defined as blood sugar levels <54 mg/dL, but not so low that a person might pass out, and experiencing one or more later symptoms of low blood sugar, including confusion, dizziness, headaches, blurred vision, tremors, muscle weakness, numbness, tingling, and cognition problems. A high blood sugar event was defined as blood sugar levels between 181 and 250 mg/dL and not necessarily accompanied by any noticeable symptoms. A very high blood sugar event was defined as blood sugar levels >250 mg/dL and possibly experiencing one or more symptoms of very high blood sugar, including extreme thirst, hunger, frequent urination, dry skin, blurred vison, drowsiness/fatigue, nausea, or trouble concentrating.
Abbreviation: A1C, hemoglobin A1c.
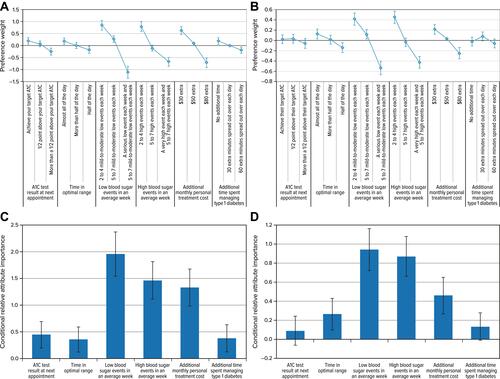
Table 2 Willingness to Pay for Improvements in Treatment Outcomes
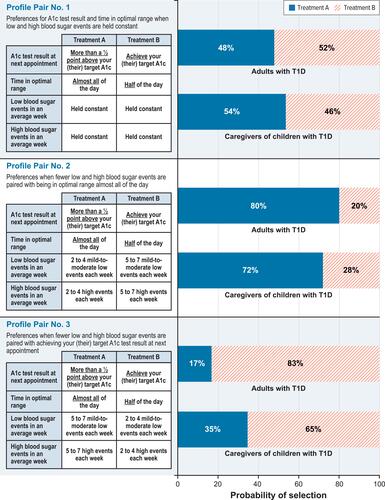
Figure 3 Preference Share Predictions.
Abbreviation: A1c, hemoglobin A1c.