
Figures & data
Table 1 Participant Characteristics (n = 436)
Table 2 Frequency Distribution for Each Option of Each Item (n/%)
Table 3 Results of Item Analysis (n = 218)
Table 4 Total Variance Explained
Figure 1 Confirmatory factor analysis model.
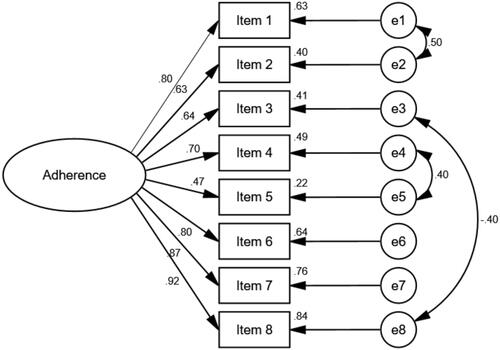
Table 5 Correlation Analysis Between Items and Between Each Item and the Total
Table 6 The Scores of HBPMAS for Non-Dialysis and Dialysis Patients