Figures & data
Table 1 DCE Attributes and Attribute Levels
Table 2 An Example of a Choice Set from the Discrete Choice Experiment
Table 3 Characteristics of Participants
Figure 1 Results mixed logit model.
Notes: (i) *Coefficients are significant at p<0.05; (ii) The vertical bar surrounding each mean preference weight denotes the 95% confidence interval for the point estimate; (iii) “OOP cost per visit” coefficient fixed, it indicates the size of the utility for each additional CNY.
Abbreviation: RI, relative importance.
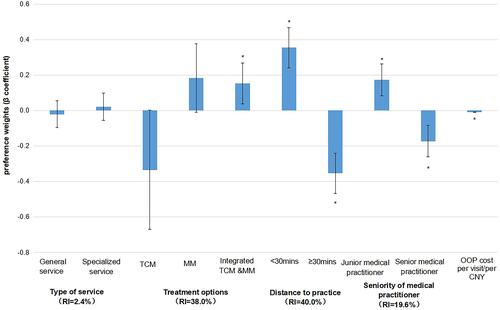
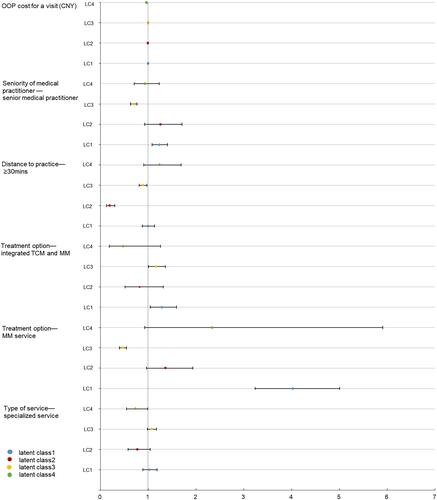
Figure 2 Latent Class model estimates: Likelihood of preferring PHCS scenario for each latent class (OR with 95% CI).