
Figures & data
Table 1 Baseline Characteristics of Immigrants and Native-Born Koreans with Hypertension Included in the Study
Figure 1 Flow diagram of the selection process of study subjects.
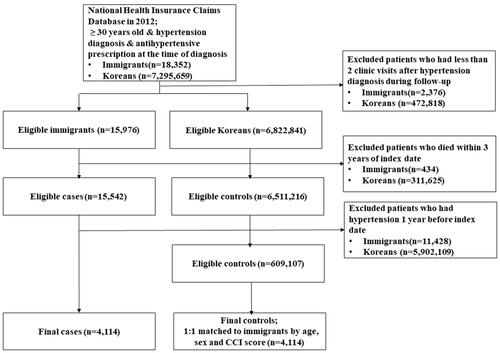
Figure 2 Mean MPR according to sex (A), age group (B), and the number of visited clinics (C) between immigrants and native-born Koreans. MPR: medication possession ratio.
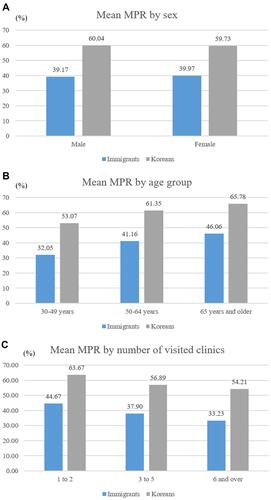
Figure 3 Medication adherence patterns for antihypertensive drugs over time between immigrants and native-born Koreans. MPR: medication possession ratio.
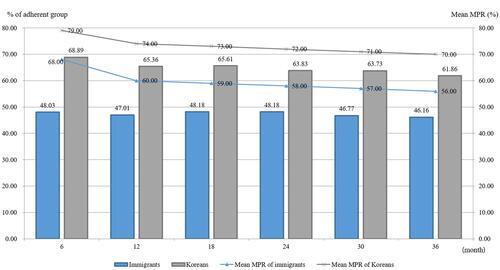
Table 2 Comparison of Non-Adherence to Antihypertensive Drugs Between Immigrants and Native-Born Koreans
Table 3 Potential Risk Factors Significantly Associated with Non-Adherence to Antihypertensive Drugs in Immigrants by Logistic Regression Analysis