93
Views
2
CrossRef citations to date
0
Altmetric
Original Research

Visit Adherence of Mild to Moderate Psoriasis Patients: A Mobile-Based Randomized Study

, ORCID Icon, , , , ORCID Icon, , , , , ORCID Icon, , , & show all
Pages 2551-2557 | Published online: 05 Jan 2021

Figures & data

Figure 1 Study flow chart. “R” indicates randomization; (a) In group A, the mobile system would automatically send massages to the responsible doctor reminding them to initiate additional proactive communication with the patients twice in the first 4 weeks, and once in 4 weeks after the second month. Patients in group B would not receive such proactive communication; (b) once a week in the first 4 weeks, and once in two weeks after the second month till week 16; (c) twice a week in the first 4 weeks, then once a week till week 52; (d) visit planned at week 2, 8, 16, 28, 48 and 52, notification would be sent 48 hours before the visit; (e) If the patients initiated a communication via the platform, the responsible doctor should respond to the patient in 24 hours.

Figure 1 Study flow chart. “R” indicates randomization; (a) In group A, the mobile system would automatically send massages to the responsible doctor reminding them to initiate additional proactive communication with the patients twice in the first 4 weeks, and once in 4 weeks after the second month. Patients in group B would not receive such proactive communication; (b) once a week in the first 4 weeks, and once in two weeks after the second month till week 16; (c) twice a week in the first 4 weeks, then once a week till week 52; (d) visit planned at week 2, 8, 16, 28, 48 and 52, notification would be sent 48 hours before the visit; (e) If the patients initiated a communication via the platform, the responsible doctor should respond to the patient in 24 hours.

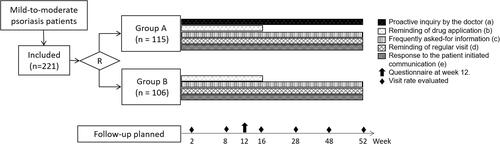
Table 1 Demographic Characteristics of the Patients

Table 2 Visit Rates in Each Group

Figure 2 Visit and lost-of-visit of the patients. Number of patients remained visit or lost to visit through the 52 weeks. Filled bar: visit in group A, empty bar: visit in group B, full line: lost-of-visit in group A, dotted line: lost-of-visit in group B.

Figure 2 Visit and lost-of-visit of the patients. Number of patients remained visit or lost to visit through the 52 weeks. Filled bar: visit in group A, empty bar: visit in group B, full line: lost-of-visit in group A, dotted line: lost-of-visit in group B.

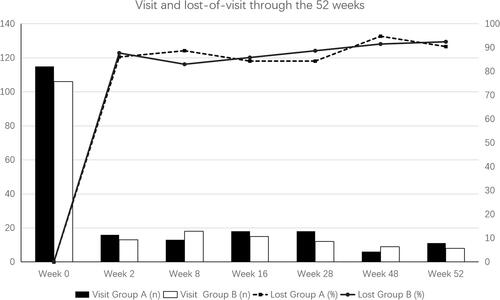
Table 3 Negative Binomial Regression for Patient Visit

Table 4 Survey on Drug Application at Week 12