Figures & data
Figure 1 Study Design. The study period spans from January 1, 2009 until December 31, 2017. The index date was defined as the first claim for a prescription for GLP-1 RA monotherapy or dual therapy with metformin following an observed 12-month baseline period.
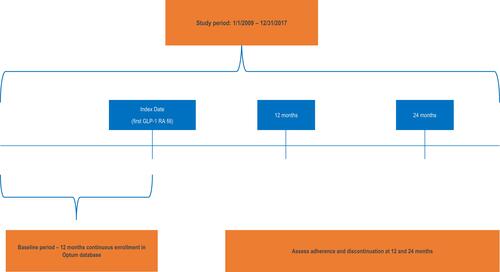
Table 1 Baseline Characteristics Among Patients with Type 2 Diabetes Initiating GLP-1 Receptor Agonist, in the Optum Clinformatics® Data Mart
Figure 2 Proportion of Patients Who Were Adherent based on PDC ≥0.8 to GLP-1 RA Therapy, n=3907. Bar charts depicting percentage of patients who were adherent to GLP-1 RA therapy over the 12 months and 24 months study period. Proportions are assessed by overall total and the following stratifications: Age groups (<65, 65–75, 75+), Gender (Male, Female), Dosage (Daily Weekly). Adherence was only assessed among patients with 2 or more GLP-1 RA prescription fills. 12 months: *Age < 65 vs 65–74 years, p=0.01, **Male vs female p<0.01, ***Weekly vs daily p<0.01. 24 months (Cumulative): ‡Age <65 vs 65–74 years p<0.01, ±<65 years vs 75+years p=0.01, §Male vs female p<0.01, £weekly vs daily p<0.01.
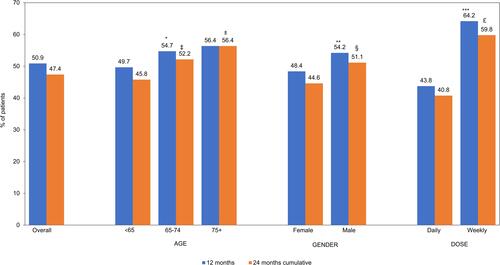
Figure 3 Time to Discontinuation of GLP-1 RAs, Kaplan–Meier Plot, n=4791. Kaplan–Meier plot of days until GLP-1 RA therapy discontinuation. Patients discontinued at median of 406 days (95% CI 386–424) after initiating therapy.
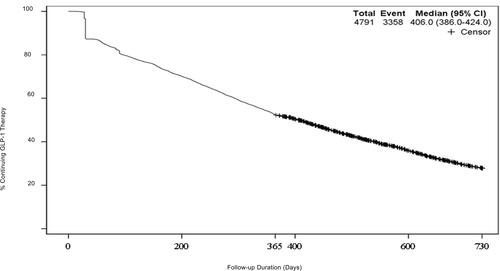
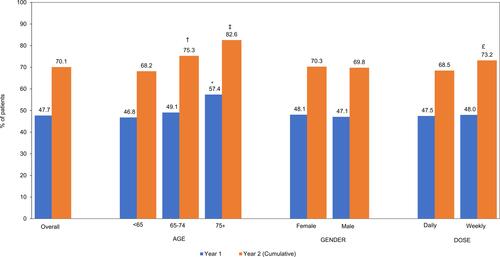
Figure 4 Proportion of Patients Who Discontinued GLP-1 RA Therapy, n=4791. Discontinuation was defined as a gap of >90 days from end of days of supply of GLP-1 RA claim and the first date of subsequent pescription claims (if any). Bar charts depicting percentage of patients who discontinued GLP-1 RA therapy over the 12 months and 24 months study period. Proportions are assessed by overall total and the following stratifications: Age groups (<65, 65–75, 75+), Gender (Male, Female), Dosage (Daily Weekly). Year 1: *Age <65 vs 75+ years p<0.01. Year 2: †Age <65 years vs 65–75 years; ‡Age <65 years vs 75 + years; £Weekly vs daily dosing, p<0.01.