
Figures & data
Table 1 General Characteristics of CRC Patients (n=197) and Summary Statistics for the EQ-5D-5L Utility Score by Participant and Clinical Characteristics
Figure 1 Distribution of the EQ-5D-5L utility score.
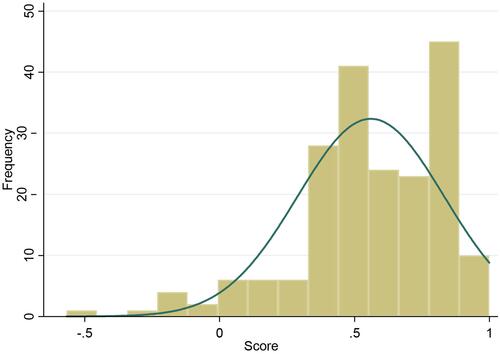
Figure 2 The proportion of levels of problem on each EQ-5D-5L dimension in the overall sample and by CRC stage (percent, %).
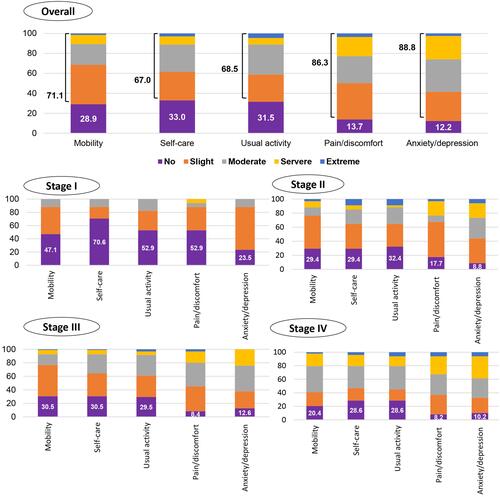
Table 2 Tobit Regression Model: Factors Associated with the EQ-5D-5L Utility Score