
Figures & data
Table 1 Prevalence of Non-Adherence Behaviors in Chronic Diseases
Figure 1 Frequency of non-adherence behaviors (non-intentional, intentional or mixed) in the different patient cohorts. Data are shown as percentages.
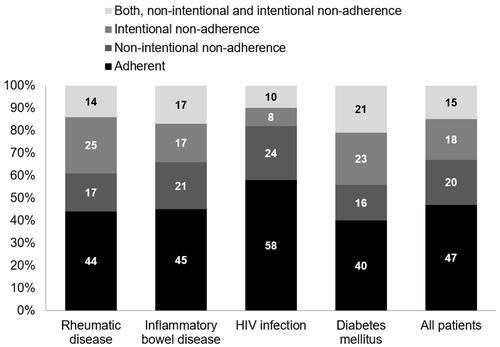
Figure 2 Frequency of non-adherence behaviors (non-intentional, intentional or mixed) by (A) quartiles of experience score (IEXPAC) and (B) quartiles of overall Beliefs in Medicines (BMQ) score. Data are shown as percentages. Quartiles of IEXPAC overall score: Q1: <4.77; Q2: 4.77–6.36; Q3: 6.36–7.27; Q4: >7.27. Quartiles of BMQ overall score: Q1: <2; Q2: 2–6; Q3: 6–11; Q4: >11.
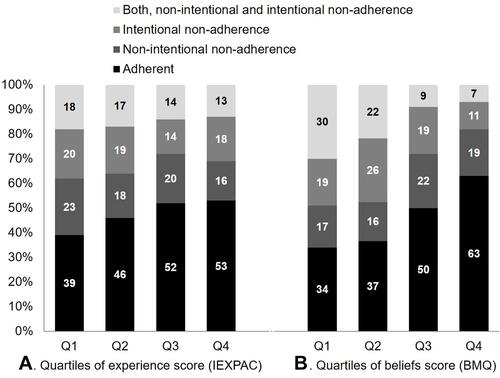
Table 2 IEXPAC Results Stratified by: Adherent Patients, Patients with Only Non-Intentional Non-Adherence Behaviors, Patients with Only Intentional Non-Adherence Behaviors, and Patients with Both Non-Intentional and Intentional Non-Adherence Behaviors (Mixed)
Table 3 BMQ Results Stratified by: Adherent Patients, Patients with Only Non-Intentional Non-Adherence Behaviors, Patients with Only Intentional Non-Adherence Behaviors, and Patients with Both Non-Intentional and Intentional Non-Adherence Behaviors (Mixed)
Table 4 Multivariate Analysis