
Figures & data
Figure 1 The full-length standing anteroposterior radiograph. (A) TD-TP: distance between the inferior aspect of teardrop (TD) and the midpoint of tibial plafond (TP). (B) CH-TP: distance between the center of hip (CH) or acetabular cup and the midpoint of tibial plafond. (C) GT-TP: distance between the apex of greater trochanter (GT) and the midpoint of tibial plafond. (D) femoral length (FL): distance between the inferior aspect of teardrop and the articular surface of medial femoral condyle. (E) tibial length (TL): distance between the center of the tibial intercondylar eminence and the midpoint of tibial plafond.
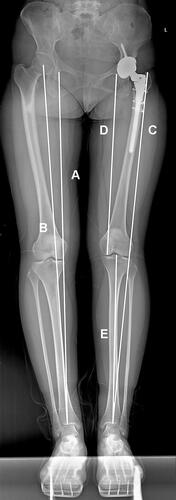
Table 1 Patient Characteristics
Table 2 Difference of Variables on Both Sides
Table 3 Results of Multiple Logistic Regression
Figure 2 The ROC curves for each measurement for radiographic LLD. Patients’ perception on LLD had good correlation and reliability on the difference of FL+TL and the difference of TD-TP on both sides in the full-length standing anteroposterior radiographs.
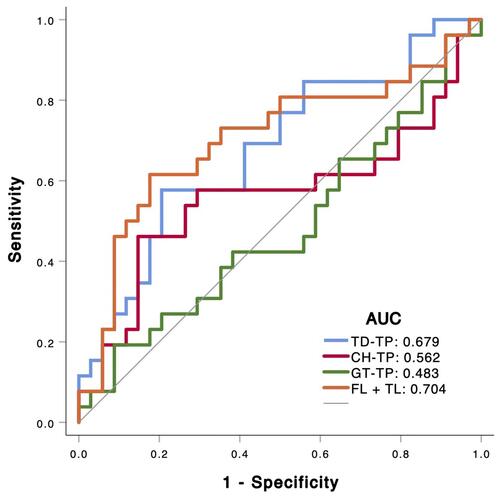
Table 4 Intraobserver and Interobserver Variations of Measurements