Figures & data
Figure 1 Study design with inclusion and exclusion criteria.
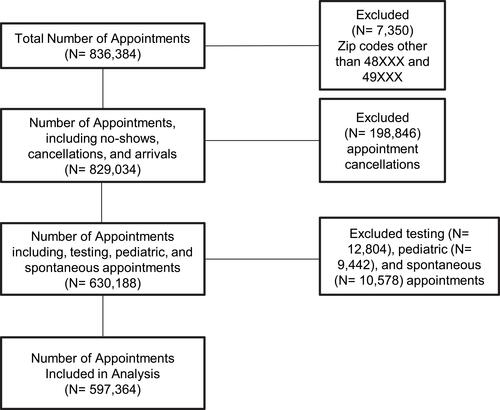
Table 1 Distribution of Demographic, Administrative, and Appointment Characteristics Among Compliant and Non-Compliant Appointments at KEI
Table 2 Summary of Continuous Appointment Characteristics
Figure 2 Frequency of appointments per ophthalmology subspecialty. The total n= 597,364 appointments were categorized across the indicated ophthalmic subspecialties seen at the KEI clinics.
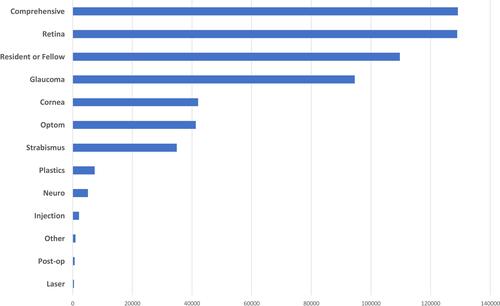
Figure 3 Frequency of appointments per racial category. The total n= 597,364 appointments were categorized across the indicated racial categories seen at the KEI clinics.
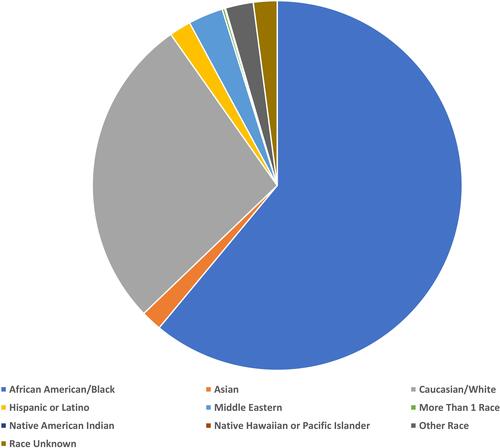
Figure 4 Appointment frequency across each zip code. The total n= 829,034 appointments were mapped across each Michigan-based zip code using Microsoft Excel (see Methods section). The enlarged area represents metro Detroit.
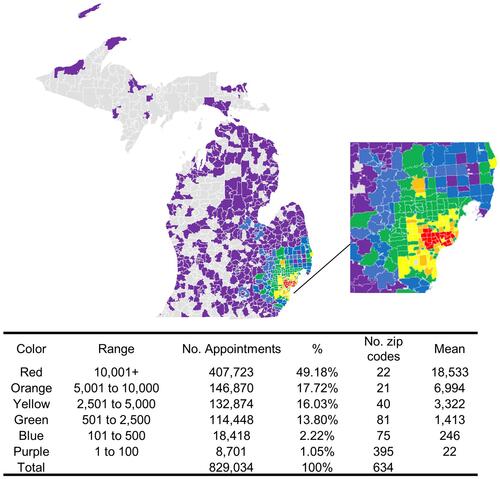
Table 3 Comprehensive Multiple Logistic Regression Across Initial Appointments
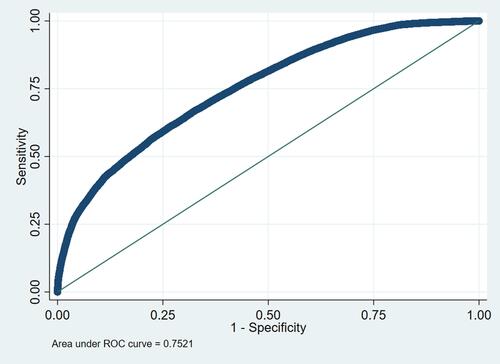
Figure 5 Receiver operating characteristic curve and associated AUC for logistic regressions across all appointments. Also refer for detailed results.