
Figures & data
Figure 1 The data collection process.
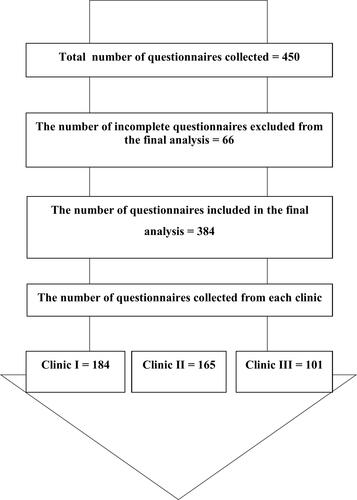
Table 1 Demographic Characteristics of the Participants
Table 2 The Participant Responses to DAI-10 Scale
Table 3 The Association of Demographics with the Level of Adherence and Quality of Life by Using the Multivariate Analysis
Table 4 The Quality of Life of the Participants