Figures & data
Table 1 Participant Characteristics in the Study Sample (N = 49)
Table 2 Results of the CPS Assessment of Patients’ Actual Roles (N = 48)
Table 3 Degrees of Agreement Between Patients’ and Researchers’ Evaluations
Table 4 Degrees of Agreement Between Patients’ Actual and Preferred Decision-Making Roles
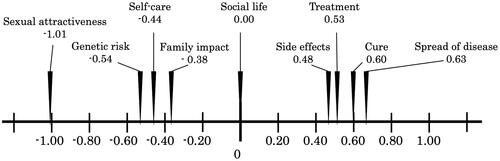
Figure 1 Information needs of breast cancer patients (N = 49).